| Journal of Hematology, ISSN 1927-1212 print, 1927-1220 online, Open Access |
| Article copyright, the authors; Journal compilation copyright, J Hematol and Elmer Press Inc |
| Journal website https://jh.elmerpub.com |
Letter to the Editor
Volume 000, Number 000, April 2025, pages 000-000

Differential MicroRNA Profiles Associated With the Hydroxyurea-Inducible SAR1A Gene
Chutima Kumkhaeka ![]() , Jianqiong Zhua, Wulin Aerbajinaia, Wannaporn Ittiprasertb
, Jianqiong Zhua, Wulin Aerbajinaia, Wannaporn Ittiprasertb ![]() , Wenli Liua, Griffin P. Rodgersa, c
, Wenli Liua, Griffin P. Rodgersa, c
aMolecular and Clinical Hematology Branch, National Heart Lung and Blood Institute, National Institutes of Health, Bethesda, MD 20892, USA
bDepartment of Microbiology, Immunology, and Tropical Medicine, School of Medicine and Health Sciences, George Washington University, Washington, DC 20037, USA
cCorresponding Author: Griffin P. Rodgers, Molecular and Clinical Hematology Branch, National Heart Lung and Blood Institute, National Institutes of Health, Bethesda, MD 20892, USA
Manuscript submitted January 6, 2025, accepted April 8, 2025, published online April 22, 2025
Short title: miRNAs Associated With SAR1A
doi: https://doi.org/10.14740/jh2021
| To the Editor | ▴Top |
Sickle cell disease (SCD) is a monogenic disorder caused by a single point mutation in the β-globin gene of adult hemoglobin which leads to red blood cell sickling, vaso-occlusion, and hemolysis [1]. Hydroxyurea (HU) is the first FDA-approved drug for SCD patients, effectively improving the clinical manifestations related to fetal hemoglobin (HbF) induction [2]. Secretion-associated Ras-related GTPase 1A (SAR1A) is a member of a small GTPase protein family and plays a role in protein trafficking from the endoplasmic reticulum to the Golgi apparatus [3, 4]. Notably, we identified that SAR1A is a specific HU-inducible gene involved in γ-globin gene induction through GATA-2/p21 signal transduction and Giα/JNK/Jun pathway in human erythroid cells [5, 6]. In addition, the changes in HbF levels after HU treatment in both adults and children with SCD showed a significant association with single-nucleotide polymorphisms (SNPs) in the SAR1A promoter [7, 8]. Taken together, these findings demonstrate an important role of SAR1A in HbF expression.
Recently, we demonstrated that the SNPs within the SAR1A 3′ untranslated region (UTR) were potential binding sites for microRNAs (miRNAs) [9]. miRNAs are small (18-22 nucleotide) non-coding RNA molecules that regulate gene expression at the post-transcriptional level by targeting specific mRNAs, resulting in mRNA degradation or translational inhibition [10]. HU at the maximum tolerated dose causes differential expression of a suite of miRNAs associated with HbF induction in patients with SCD [11]. However, the functions of these differentially expressed miRNAs in HU-mediated HbF induction are not fully understood. In this study, we hypothesized that miRNAs associated with SAR1A may be involved in HbF expression. Therefore, we used small-RNA sequencing to carry out the first comprehensive survey of miRNAs expressed in SAR1A-knockout K562 cells without or with HU treatment and assessed their potential functions related to HbF induction.
To identify the miRNAs associated with SAR1A, we used a GFP-tagged SAR1A-CRISPR/Cas9 knockout plasmid to knock out SAR1A gene expression in K562 cells and then treated the cells with HU for 72 h (Supplementary Material 1, jh.elmerpub.com). The SAR1A mRNA and protein levels were reduced in SAR1A-knockout K562 cells without or with HU treatment, but HbF induction was not rescued after HU treatment in SAR1A-knockout K562 cells (Supplementary Material 2, jh.elmerpub.com). We used miRNA sequencing to investigate miRNAs in three pairs of wild-type and SAR1A-knockout K562 cells without or with HU treatment. A principal component analysis (PCA) plot showed a clear separation of miRNA expression profile into distinct clusters between wild-type and SAR1A-knockout K562 cells, without HU treatment (PCA = 75.1%) or with HU treatment (PCA = 78.5%) (Fig. 1a). In addition, hierarchical clustering showed consistent group separation and categorical assignments that were completely accordant with the SAR1A-knockout phenotype (Fig. 1b). These results indicate that SAR1A significantly modulates a unique miRNA signature which is potentially involved in HbF induction.
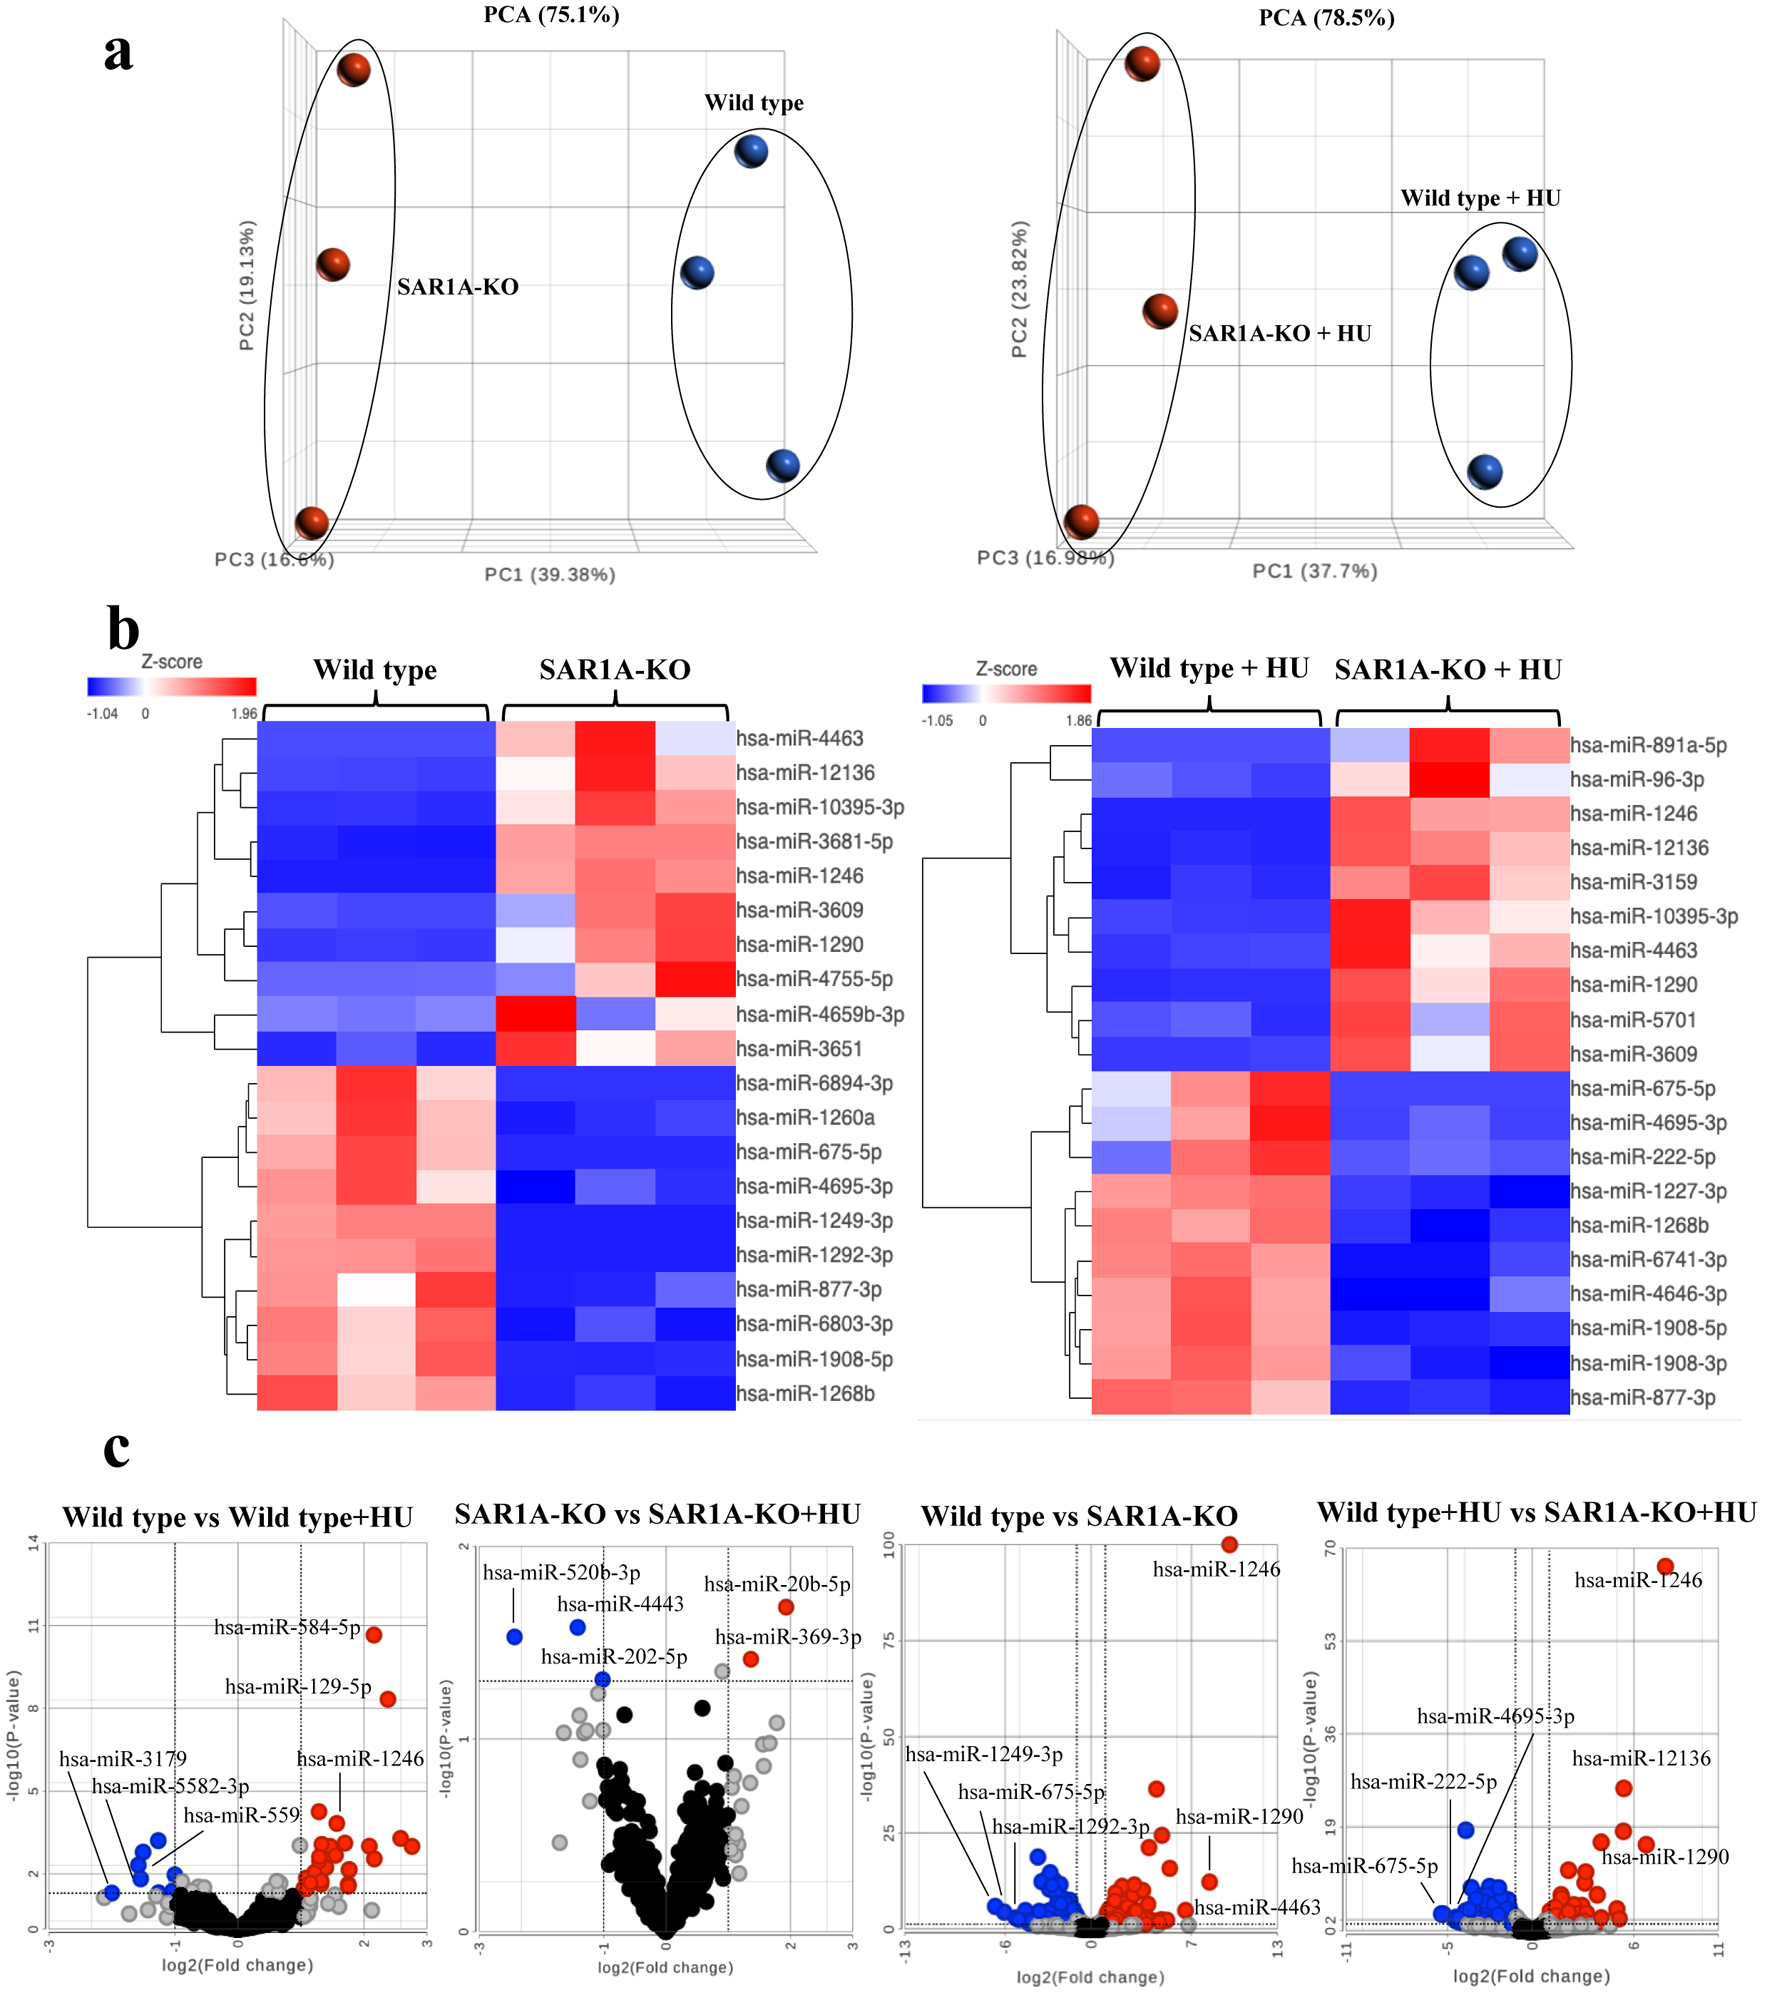 Click for large image | Figure 1. Plots of differentially expressed miRNAs from three sample groups each of wild-type and SAR1A-knockout (SAR1-KO) K562 cells without or with hydroxyurea (HU) treatment. (a) Principle component analysis (PCA) clustering of miRNA expression by sample group is denoted by different color (wild type - blue; SAR1A-knockout - red) and reveals complete separation of miRNA expression after the knockout of SAR1A expression. (b) A heatmap illustrating miRNA expression patterns. The dendrograms show hierarchical clusters representing the similarities and dissimilarities in expression profiles among samples and miRNAs. (c) Volcano plots of miRNAs expressed differentially in wild type or SAR1A-knockout K562 cells compared with those with HU treatment and SAR1A-knockout K562 cells without or with HU treatment relative to the wild type. The red dots represent the significantly upregulated miRNAs by P < 0.05 and fold change > 2, blue dots represent the significantly downregulated miRNAs by P < 0.05 and fold change < 2, gray dots represent miRNAs that were upregulated or downregulated at least two-fold but were not significant by P < 0.05, and black dots represent miRNAs that were not differentially expressed. Named miRNAs are those with the three largest fold-changes among the down- or upregulated miRNAs in wild type and SAR1A-knockout K562 cells without or with hydroxyurea treatment. |
We used the stringent criteria of a false discovery rate (FDR) < 0.05 and fold-change less than -2 or greater than 2 to identify the differentially expressed miRNAs. Without HU treatment, we found 132 miRNAs that were differentially expressed between SAR1A-knockout K562 cells and wild-type control K562 cells. Of these, 51 differentially expressed miRNAs were upregulated and 81 were downregulated in untreated SAR1A-knockout K562 cells compared with the wild-type cells (Fig. 1c). After HU treatment, 99 miRNAs were differentially expressed between SAR1A-knockout and wild-type control K562 cells; of these, 49 were upregulated and 50 were downregulated (Fig. 1c). The 10 downregulated and 10 upregulated miRNAs with the largest fold-change in cells without or with HU treatment are shown in Supplementary Material 3, 4 (jh.elmerpub.com), respectively. Among the differentially expressed miRNAs, a few (hsa-miR-16-1-3p, hsa-miR-26b-3p, hsa-miR-29a-3p, hsa-miR-130b-5p, hsa-miR144-5p, hsa-miR-210-5p, hsa-miR-215-5p, hsa-miR-223-5p, hsa-miR-486-3p, hsa-miR-92a-3p, and hsa-miR-96-3p) had previously been implicated in HU-induced HbF expression or the regulation of γ-globin gene expression [12, 13]. A Venn diagram exploring the differentially expressed miRNAs intersections identified 75 common differentially expressed miRNAs among SAR1A-knockout K562 cells without and with HU treatment (Supplementary Material 5, jh.elmerpub.com). In addition, 57 and 24 differentially expressed miRNAs were uniquely identified in SAR1A-knockout K562 cells without and with HU treatment, respectively. These findings show that SAR1A knockout alters the miRNAs response to HU, suggesting its pivotal role in HU-mediated HbF induction.
Interestingly, we found only four miRNAs (hsa-miR-584-5p, hsa-miR-129-5p, hsa-miR-9-3p, and hsa-miR-1246) that were differentially upregulated in wild-type K562 cells with HU treatment compared with those without HU treatment with our stringent criteria of FDR < 0.05 and fold-change less than -2 or greater than 2. Additionally, there was no significant differentially expressed miRNAs identified in SAR1A-knockout K562 cells with HU treatment compared with those without HU treatment. When we used less stringent criteria (P-value < 0.05 and fold-change less than -2 or greater than 2), 35 miRNAs were differentially expressed between wild-type control K562 cells with HU treatment and without HU treatment; of these, 27 were upregulated and eight were downregulated (Fig. 1c and Supplementary Material 6, jh.elmerpub.com). We also found five miRNAs that were differentially expressed between SAR1A-knockout K562 cells with HU treatment and without HU treatment. Of these, two (hsa-miR-369-3p and hsa-miR-20b-5p) were upregulated and three (hsa-miR-520b-3p, hsa-miR-4443, and hsa-miR-202-5p) were downregulated (Fig. 1c). These data suggest that HU treatment has some effects on miRNAs expression in both wild-type and SAR1A-knockout K562 cells but more impact in wild-type than SAR1A-knockout K562 cells. Moreover, this finding indicates that some HU-responsive miRNAs require SAR1A.
To confirm the miRNA sequencing data, we selected the top three upregulated and downregulated miRNAs in each group with the largest fold-change for quantitative reverse transcription-polymerase chain reaction (qRT-PCR) verification using a TaqMan miRNA assay. Nine miRNAs were selected for this assay: hsa-miR-1249-3p, hsa-miR-675-5p, hsa-miR-1292-3p, hsa-miR-1246, hsa-miR-1290, hsa-miR-4463, hsa-miR-222-5p, hsa-miR-4695-3p, and hsa-miR-12136. Without HU treatment, hsa-miR-1249-3p, hsa-miR-675-5p, and hsa-miR-1292-3p were significantly downregulated in SAR1A-knockout K562 cells compared with the controls and hsa-miR-1246, hsa-miR-1290, and hsa-miR-4463 were upregulated. After HU treatment, hsa-miR-675-5p, hsa-miR-222-5p, and hsa-miR-4695-3p were downregulated and hsa-miR-1246, hsa-miR-1290, and hsa-miR-12136 were upregulated in SAR1A-knockout K562 cells compared with the controls (Supplementary Material 7, jh.elmerpub.com). These results were consistent with those of the miRNA sequencing data.
To identify the target genes for the differentially expressed miRNAs, we used Partek Flow and selected TargetScan 8.0 as the search mode. All target genes identified for the differentially expressed miRNAs in SAR1A-knockout K562 cells without or with HU treatment are shown in Supplementary Material 8, 9 (jh.elmerpub.com), respectively. Some of the differentially expressed miRNAs were potentially targeted to 11 genes (DNMT1, DNMT3A, GATAD2B, HDAC1, IKZF1, KLF1, MYB, PPARGC1A, RUNX1, SOX6, and ZBTB7A) that were previously reported to influence HbF expression (Fig. 2a and Supplementary Material 10, jh.elmerpub.com). The MYB, KLF1, and BCL11A genes are involved in the silencing of γ-globin gene expression [14]. A previous study demonstrated that hsa-miR-15a/16, hsa-miR-26b, hsa-miR-29b, and hsa-miR-105-5p regulate γ-globin gene expression by targeting MYB [15]. Moreover, KLF1 was previously reported to be a target gene for hsa-miR-15a/16, hsa-miR-26b, hsa-miR-151-3p, hsa-miR-326, and hsa-miR-451; these miRNAs are related to HbF expression [15]. We consistently found MYB as the predicted target for hsa-miR-16-5p. Two novel miRNAs, hsa-miR-130b-3p and hsa-miR-330-5p, targeted MYB and KLF1, respectively, but BCL11A was not detected to be a target gene for the miRNAs differentially expressed in response to SAR1A knockout.
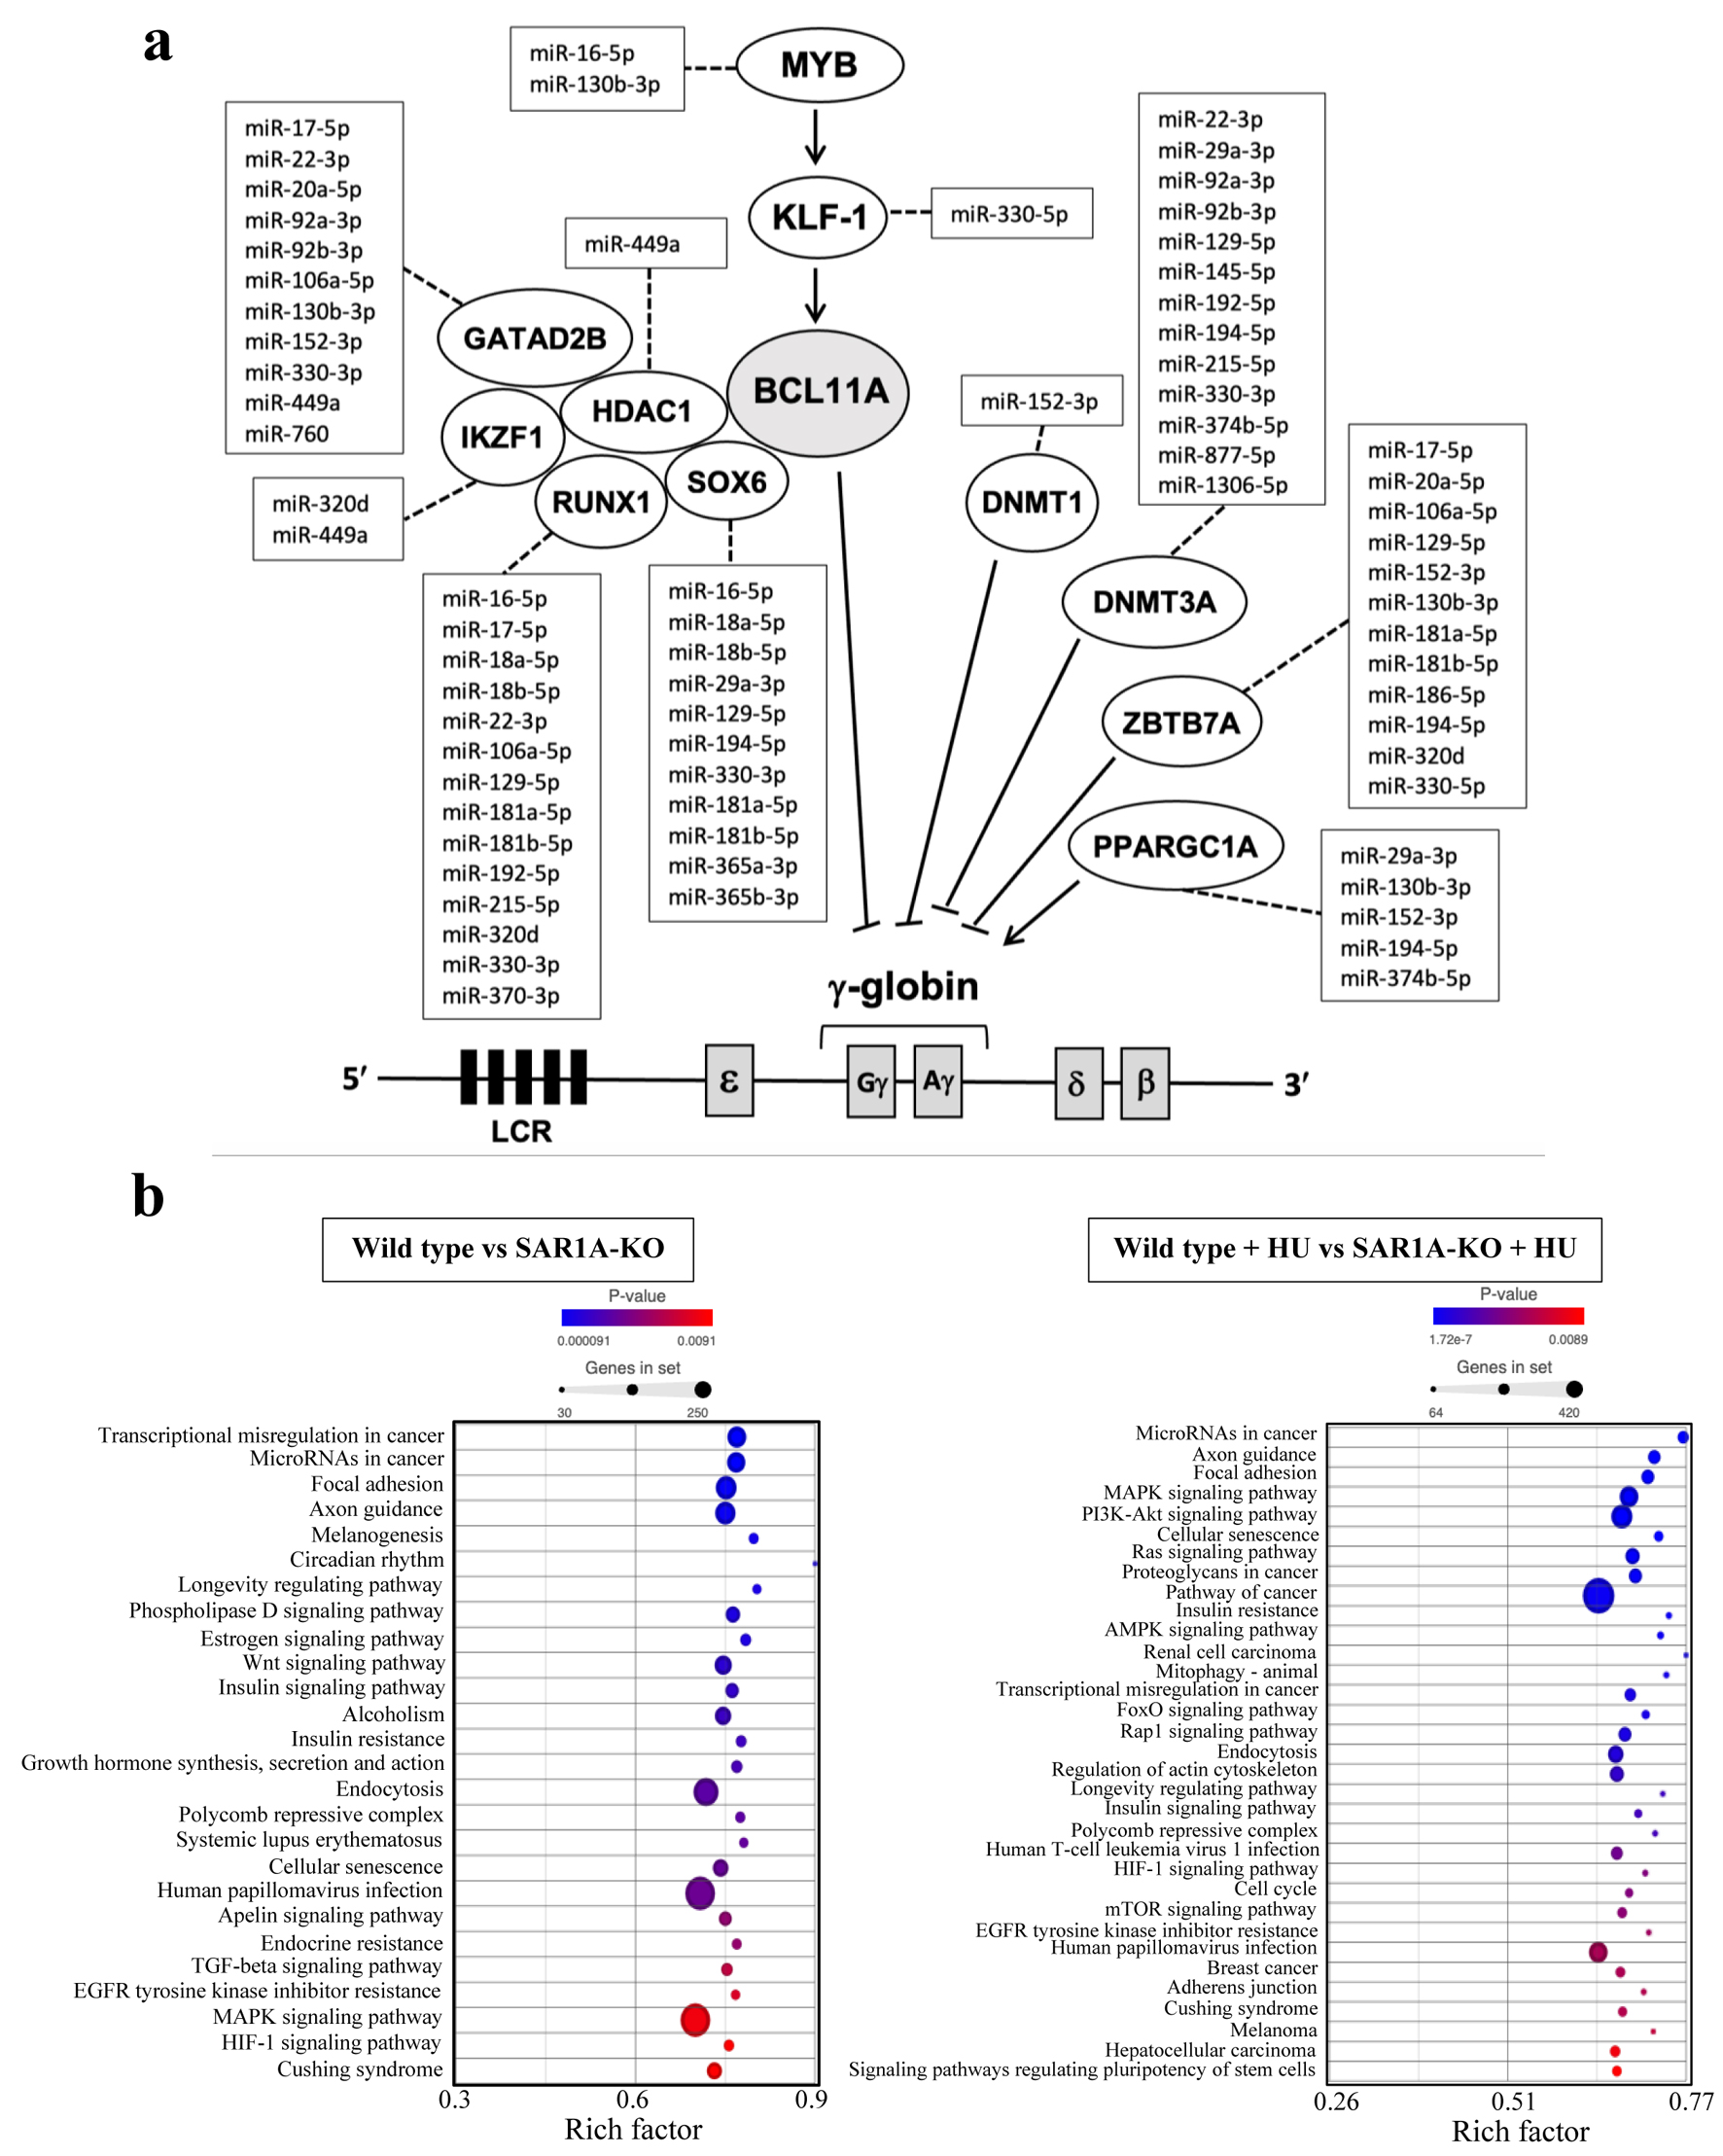 Click for large image | Figure 2. Target genes and Kyoto Encyclopedia of Genes and Genomes (KEGG) pathway analysis of miRNAs differentially expressed in response to SAR1A knockout. (a) The differentially expressed miRNAs link to 11 genes (DNMT1, DNMT3A, GATAD2B, HDAC1, IKZF1, KLF1, MYB, PPARGC1A, RUNX1, SOX6, and ZBTB7A) that were previously reported to influence HbF expression. The dotted lines indicate predicted links of differentially expressed miRNAs to target genes. (b) Significantly enriched KEGG pathways involving 132 and 99 differentially expressed miRNAs in SAR1A-knockout K562 cells without and with hydroxyurea (HU) treatment, respectively. Those KEGG pathways with P < 0.01 were selected. |
We also explored the significant biological and functional role of these miRNA target genes by using Partek Flow to identify pathways in the Kyoto Encyclopedia of Genes and Genomes (KEGG) with P < 0.01. The target genes of miRNAs differentially expressed in SAR1A-knockout K562 cells without HU treatment belong to signaling pathways implicated in γ-globin regulation such as Wnt [16], TGF-β [17], and MAPK and HIF-1 (Fig. 2b). With HU treatment, the differentially expressed miRNAs were in the MAPK, PI3K-Akt, HIF-1, and mTOR signaling pathways, which are also pathways implicated in γ-globin regulation.
In our study, the downregulation of hsa-miR-16-1-3p, hsa-miR-26b-3p, hsa-miR-130b-5p, hsa-miR-210-5p, hsa-miR-223-5p, and hsa-miR-92a-3p and the upregulation of hsa-miR-29a-3p, hsa-215-5p, hsa-miR-486-3p, and hsa-miR-96-3p were significantly associated with SAR1A downregulation which mediated the reduction of HbF. Sankaran et al (2011) and Pule et al (2016) demonstrated that hsa-miR-16-1 and hsa-miR-26b induce HbF expression via MYB, respectively [18, 19]. The role of hsa-miR-210 and hsa-miR-92a-3p on HbF induction through BCL11A was reported by Gasparello et al (2017) and Li et al (2022), respectively [20, 21]. In contrast, Azzouzi et al (2011) found that hsa-miR-96 inhibits γ-globin gene expression by binding to the ORF of γ-globin mRNA [22]. These studies support our finding that hsa-miR-16-1, hsa-miR-26b, hsa-miR-210, and hsa-miR-92a-3p may act as positive regulators of the γ-globin gene, while hsa-miR-96 is a negative regulator of the γ-globin gene.
In summary, our findings suggest a profile of dysregulated miRNAs associated with SAR1A downregulation which may influence HbF expression directly or indirectly targeting the transcription factors linked to γ-globin gene regulation. These SAR1A-regulated miRNAs might also modulate HbF expression through targeting genes in known (MAPK, PI3K-Akt, mTOR, Wnt or HIF-1, etc.) or novel pathway, influencing chromatin structure and transcription factors relevant to HbF regulation. Additionally, these miRNAs could be the candidates for future therapeutic agents for HbF induction that might include miRNA mimics or inhibitors targeting to the regulators of γ-globin gene such as hsa-miR-130b-3p and or hsa-miR-330-5p which target MYB and KLF1, respectively. The limitations of this study include the relatively small sample size and the use of an in vitro cell line model. Therefore, there is a need for validation studies conducted with human hematopoietic stem/progenitor cells. Moreover, future studies are required to investigate the functional mechanisms of SAR1A-regulated miRNAs-mediated HbF expression.
| Supplementary Material | ▴Top |
Suppl 1. Experimental and bioinformatic approaches investigating miRNA expression, targets, and pathway regulation.
Suppl 2. Knockout of the SAR1A gene reduces SAR1A mRNA and protein expression but does not rescue HbF induction during HU treatment.
Suppl 3. Downregulated and upregulated miRNAs with the 10 largest fold-changes in SAR1A-knockout K562 cells without HU treatment compared with wild type, FDR < 0.05 and fold change > 2 or < -2.
Suppl 4. Downregulated and upregulated miRNAs with the 10 largest fold-changes in SAR1A-knockout K562 cells with HU treatment compared with wild type with HU treatment, FDR < 0.05 and fold change > 2 or < -2.
Suppl 5. Venn Diagram showing the intersections of the differentially expressed miRNAs from SAR1A-knockout K562 cells compared to wild type without or with HU treatment.
Suppl 6. Downregulated and upregulated miRNAs in wild-type K562 cells with HU treatment compared with those without HU treatment, P < 0.05 and fold change > 2 or < -2.
Suppl 7. Validation of candidate miRNAs identified by miRNA sequencing using qRT-PCR.
Suppl 8. List of Target genes of miRNAs differentially expressed in SAR1A-knockout K562 cells without HU treatment.
Suppl 9. List of Target genes of miRNAs differentially expressed in SAR1A-knockout K562 cells with HU treatment.
Suppl 10. Linkage between miRNAs differentially downregulated and upregulated in SAR1A-knockout K562 cells without or with HU treatment and 11 genes previously reported to influence HbF expression.
Acknowledgments
This study was supported by the Intramural Research Program, National Institutes of Diabetes and Digestive and Kidney Disease, National Institutes of Health.
Financial Disclosure
None to declare.
Conflict of Interest
None to declare.
Informed Consent
Not applicable.
Author Contributions
CK designed the study, conducted the experiments, interpreted the data, and drafted the manuscript; JZ, WA, WI, and WL contributed to the study design and data discussion; and GPR conceptualized the study, evaluated the data, and revised the manuscript.
Data Availability
Data supporting the findings of this study are included in the article and its supplementary files.
| References | ▴Top |
- Sundd P, Gladwin MT, Novelli EM. Pathophysiology of sickle cell disease. Annu Rev Pathol. 2019;14:263-292.
doi pubmed - McGann PT, Ware RE. Hydroxyurea therapy for sickle cell anemia. Expert Opin Drug Saf. 2015;14(11):1749-1758.
doi pubmed - Sato K, Nakano A. Mechanisms of COPII vesicle formation and protein sorting. FEBS Lett. 2007;581(11):2076-2082.
doi pubmed - Van der Verren SE, Zanetti G. The small GTPase Sar1, control centre of COPII trafficking. FEBS Lett. 2023;597(6):865-882.
doi pubmed - Tang DC, Zhu J, Liu W, Chin K, Sun J, Chen L, Hanover JA, et al. The hydroxyurea-induced small GTP-binding protein SAR modulates gamma-globin gene expression in human erythroid cells. Blood. 2005;106(9):3256-3263.
doi pubmed - Zhu J, Chin K, Aerbajinai W, Kumkhaek C, Li H, Rodgers GP. Hydroxyurea-inducible SAR1 gene acts through the Gialpha/JNK/Jun pathway to regulate gamma-globin expression. Blood. 2014;124(7):1146-1156.
doi pubmed - Kumkhaek C, Taylor JGt, Zhu J, Hoppe C, Kato GJ, Rodgers GP. Fetal haemoglobin response to hydroxycarbamide treatment and sar1a promoter polymorphisms in sickle cell anaemia. Br J Haematol. 2008;141(2):254-259.
doi pubmed - Green NS, Ender K, Pashankar F, Driscoll C, Giardina P, Mullen CA, Clark L, et al. Genetics of HbF and HbF response to hydroxyurea in pediatric sickle cell disease: a multi-site pilot analysis of candidate SNP variants. Blood. 2010;116:2641.
- Kumkhaek C, Kim C, Kurban G, Zhu J, Aerbajinai W, Taylor JG, Rodgers GP. Single nucleotide polymorphisms in SAR1A coding regions in sickle cell disease and their potential miRNA binding sites. EJHaem. 2022;3(4):1438-1441.
doi pubmed - Bartel DP. MicroRNAs: genomics, biogenesis, mechanism, and function. Cell. 2004;116(2):281-297.
doi pubmed - Walker AL, Steward S, Howard TA, Mortier N, Smeltzer M, Wang YD, Ware RE. Epigenetic and molecular profiles of erythroid cells after hydroxyurea treatment in sickle cell anemia. Blood. 2011;118(20):5664-5670.
doi pubmed - Kargutkar N, Sawant-Mulay M, Hariharan P, Chandrakala S, Nadkarni A. Role of microRNA in hydroxyurea mediated HbF induction in sickle cell anaemia patients. Sci Rep. 2023;13(1):369.
doi pubmed - Gambari R, Waziri AD, Goonasekera H, Peprah E. Pharmacogenomics of drugs used in beta-Thalassemia and sickle-cell disease: from basic research to clinical applications. Int J Mol Sci. 2024;25(8):4263.
doi pubmed - Bauer DE, Orkin SH. Update on fetal hemoglobin gene regulation in hemoglobinopathies. Curr Opin Pediatr. 2011;23(1):1-8.
doi pubmed - Starlard-Davenport A, Gu Q, Pace BS. Targeting genetic modifiers of HBG gene expression in sickle cell disease: the miRNA option. Mol Diagn Ther. 2022;26(5):497-509.
doi pubmed - Jin T, Zhang Z, Han Y, Li D, Liu J, Jiang M, Zhu J, et al. Transmembrane protein ANTXR1 regulates gamma-globin expression by targeting the Wnt/beta-catenin signaling pathway. J Immunol Res. 2022;2022:8440422.
doi pubmed - Kaneko K, Furuyama K, Aburatani H, Shibahara S. Hypoxia induces erythroid-specific 5-aminolevulinate synthase expression in human erythroid cells through transforming growth factor-beta signaling. FEBS J. 2009;276(5):1370-1382.
doi pubmed - Sankaran VG, Menne TF, Scepanovic D, Vergilio JA, Ji P, Kim J, Thiru P, et al. MicroRNA-15a and -16-1 act via MYB to elevate fetal hemoglobin expression in human trisomy 13. Proc Natl Acad Sci U S A. 2011;108(4):1519-1524.
doi pubmed - Pule GD, Mowla S, Novitzky N, Wonkam A. Hydroxyurea down-regulates BCL11A, KLF-1 and MYB through miRNA-mediated actions to induce gamma-globin expression: implications for new therapeutic approaches of sickle cell disease. Clin Transl Med. 2016;5(1):15.
doi pubmed - Gasparello J, Fabbri E, Bianchi N, Breveglieri G, Zuccato C, Borgatti M, Gambari R, et al. BCL11A mRNA targeting by miR-210: a possible network regulating gamma-globin gene expression. Int J Mol Sci. 2017;18(12):2530.
doi pubmed - Li H, Lin R, Li H, Ou R, Wang K, Lin J, Li C. MicroRNA-92a-3p-mediated inhibition of BCL11A upregulates gamma-globin expression and inhibits oxidative stress and apoptosis in erythroid precursor cells. Hematology. 2022;27(1):1152-1162.
doi pubmed - Azzouzi I, Moest H, Winkler J, Fauchere JC, Gerber AP, Wollscheid B, Stoffel M, et al. MicroRNA-96 directly inhibits gamma-globin expression in human erythropoiesis. PLoS One. 2011;6(7):e22838.
doi pubmed
This article is distributed under the terms of the Creative Commons Attribution Non-Commercial 4.0 International License, which permits unrestricted non-commercial use, distribution, and reproduction in any medium, provided the original work is properly cited.
Journal of Hematology is published by Elmer Press Inc.