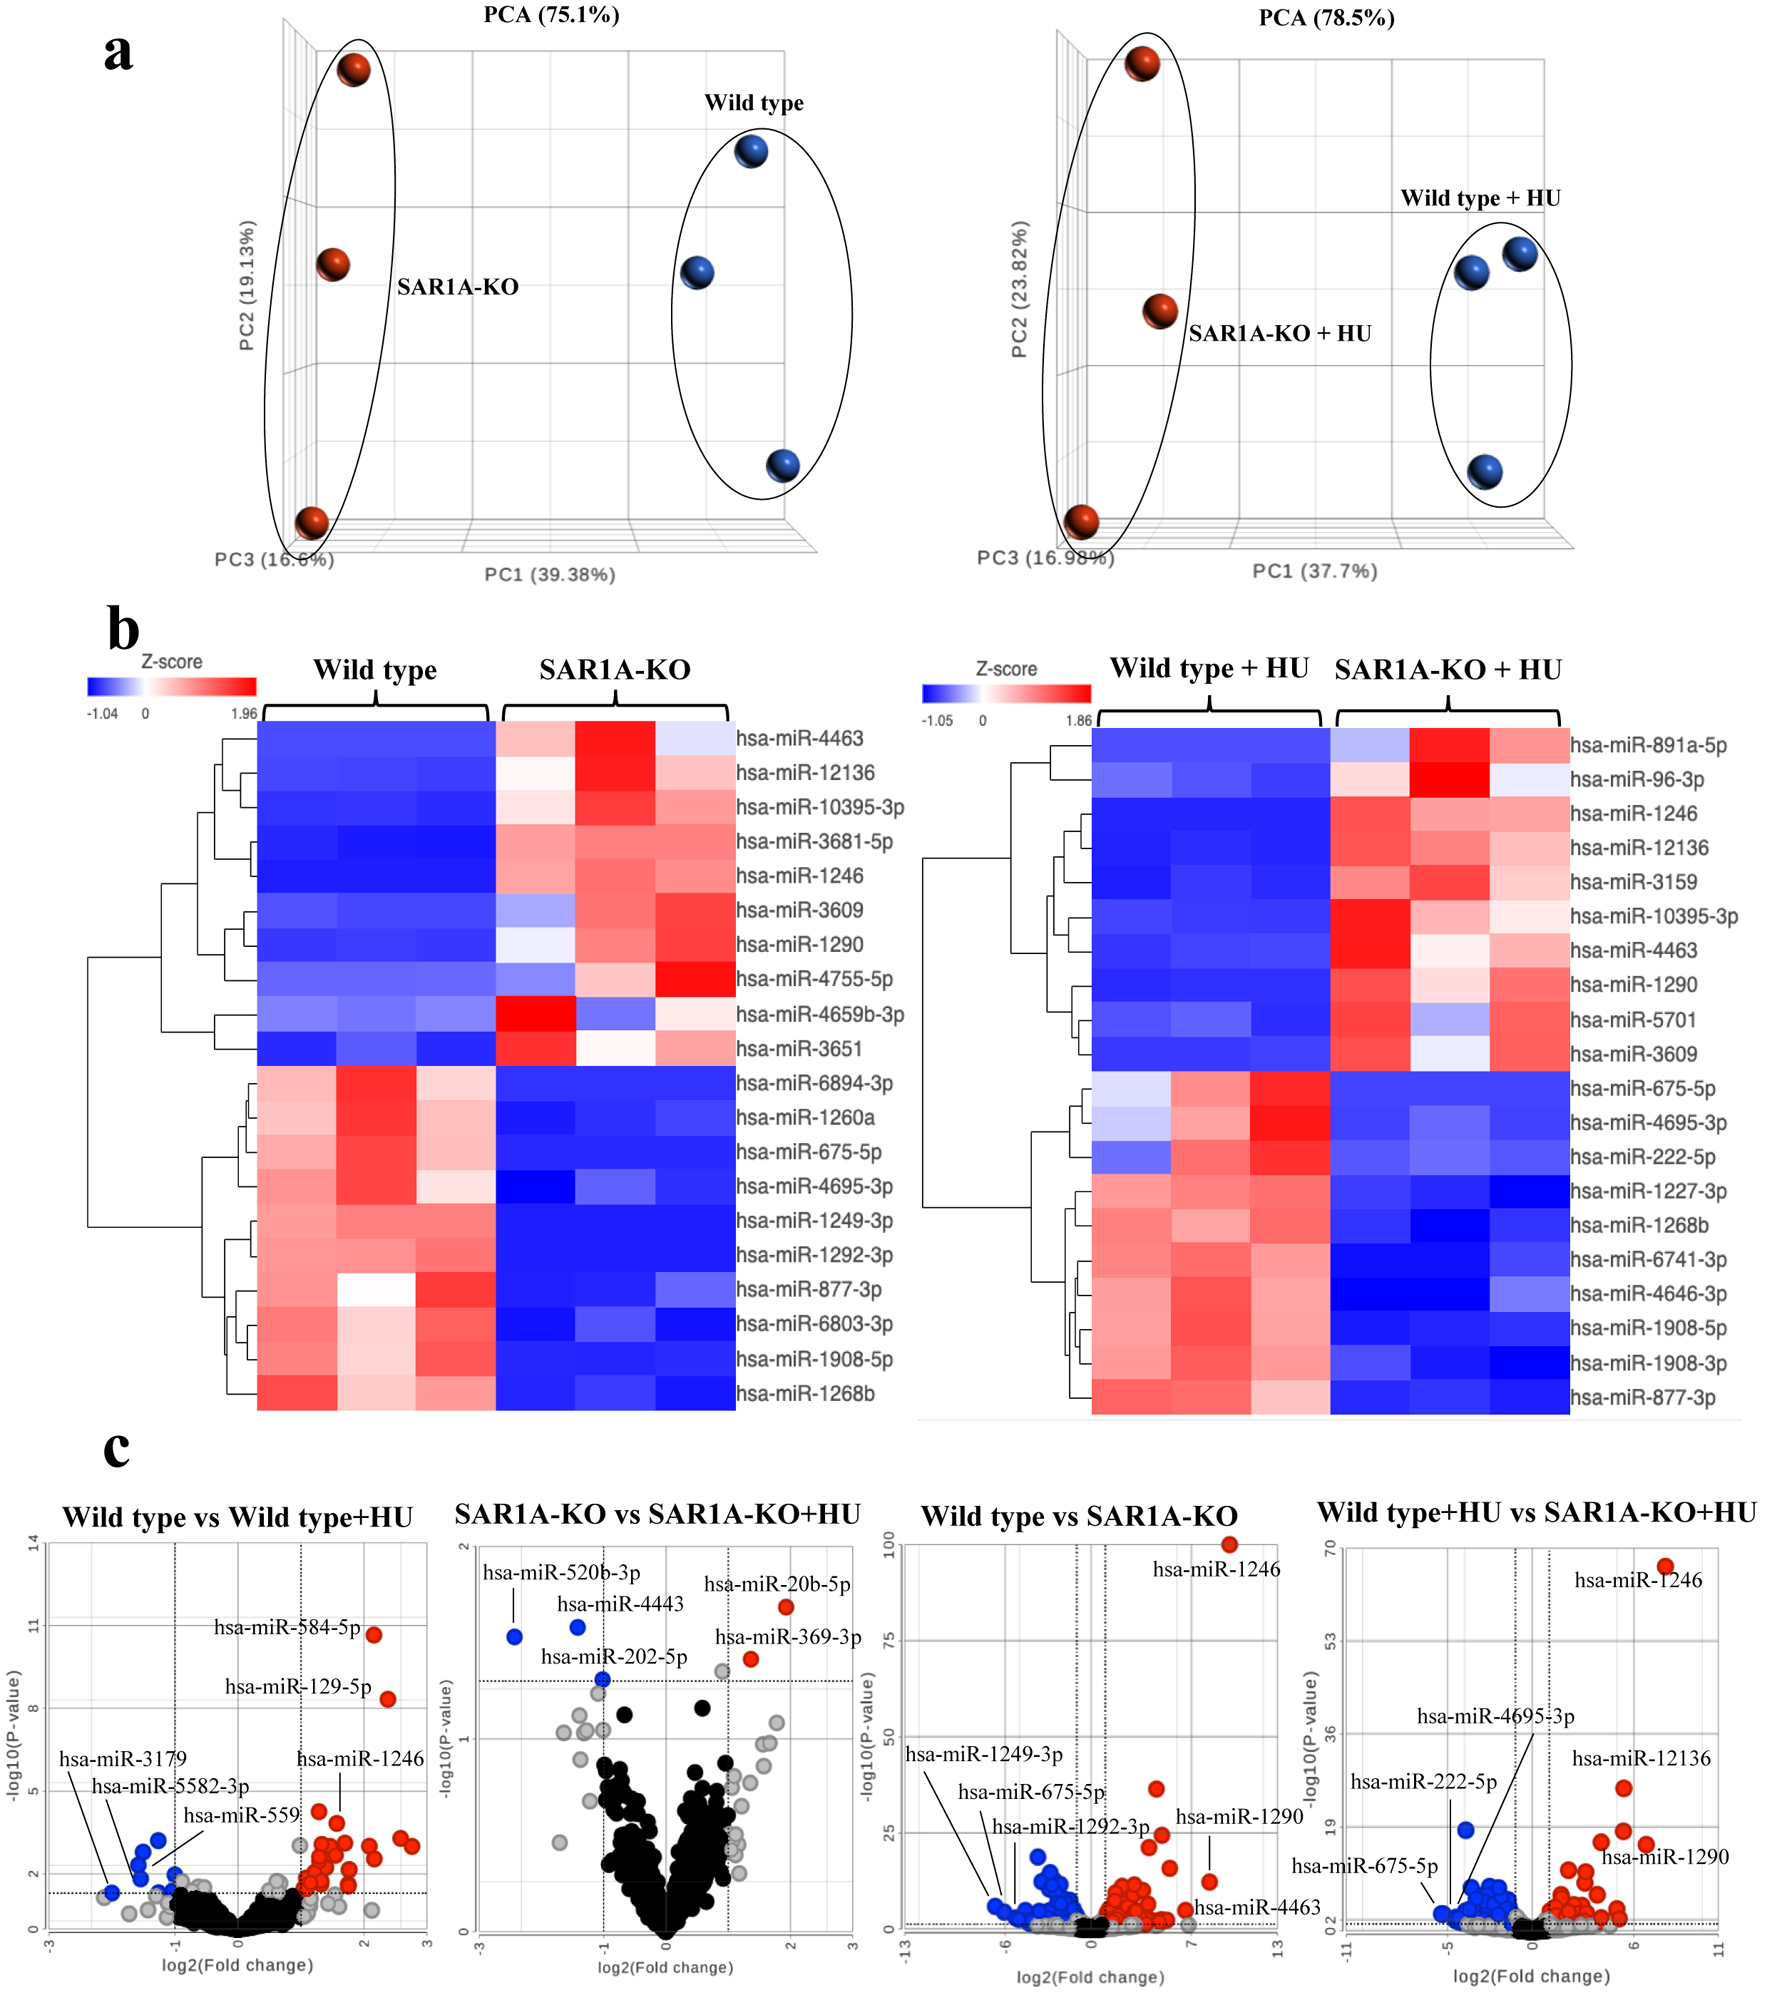
↓ Figure 1. Plots of differentially expressed
miRNAs from three sample groups each of wild-type and SAR1A-knockout (SAR1-KO) K562 cells without
or with hydroxyurea (HU) treatment. (a) Principle component analysis (PCA) clustering of miRNA
expression by sample group is denoted by different color (wild type - blue; SAR1A-knockout - red)
and reveals complete separation of miRNA expression after the knockout of SAR1A expression. (b) A
heatmap illustrating miRNA expression patterns. The dendrograms show hierarchical clusters representing
the similarities and dissimilarities in expression profiles among samples and miRNAs. (c) Volcano plots
of miRNAs expressed differentially in wild type or SAR1A-knockout K562 cells compared with those
with HU treatment and SAR1A-knockout K562 cells without or with HU treatment relative to the wild
type. The red dots represent the significantly upregulated miRNAs by P < 0.05 and fold change > 2,
blue dots represent the significantly downregulated miRNAs by P < 0.05 and fold change < 2, gray
dots represent miRNAs that were upregulated or downregulated at least two-fold but were not significant
by P < 0.05, and black dots represent miRNAs that were not differentially expressed. Named miRNAs are
those with the three largest fold-changes among the down- or upregulated miRNAs in wild type and
SAR1A-knockout K562 cells without or with hydroxyurea treatment.