Journal of Hematology, ISSN 1927-1212 print, 1927-1220 online, Open Access
Article copyright, the authors; Journal compilation copyright, J Hematol and Elmer Press Inc
Journal website https://jh.elmerpub.com

Original Article

Volume 15, Number 3, June 2026, pages 144-155


Prognostic Significance of Isolated Beta 2-Microglobulin Elevation in Thai Multiple Myeloma: Impact of Renal Function Assessment

Figures

↓  Figure 1. Best treatment response following induction therapy. Stacked bar chart illustrating the distribution of the best response levels among patients with newly diagnosed multiple myeloma, stratified by prognostic group: group A (standard risk: β2M < 5.5 mg/L), group B (isolated high β2M: β2M ≥ 5.5 mg/L with creatinine < 1.2 mg/dL), and group C (high β2M with renal impairment: β2M ≥ 5.5 mg/L with creatinine ≥ 1.2 mg/dL). Percentages within each bar represent the proportion of patients achieving each response category. Response categories are defined according to IMWG criteria, ranging from sCR to PD. Response data were available for 218 patients. β2M: β2-microglobulin; sCR: stringent complete response; CR: complete response; VGPR: very good partial response; PR: partial response; SD: stable disease; PD: progressive disease.
Figure 1.
↓  Figure 2. Survival outcomes stratified by β2M using serum creatinine– and creatinine clearance–based definitions of renal function. Kaplan–Meier estimates of overall survival (OS) and progression-free survival (PFS) among patients with newly diagnosed multiple myeloma. Panels (a) and (b) show OS and PFS, respectively, stratified by the 2024 IMS–IMWG serum creatinine–based criteria: group A (standard risk: β2M < 5.5 mg/L), group B (isolated high β2M: β2M ≥ 5.5 mg/L with serum creatinine < 1.2 mg/dL), and group C (high β2M with renal impairment: β2M ≥ 5.5 mg/L with serum creatinine ≥ 1.2 mg/dL). Panels (c) and (d) show OS and PFS, respectively, stratified by the creatinine clearance–based definition of renal function: low β2M, high β2M with preserved renal function (CrCl ≥ 60 mL/min), and high β2M with renal impairment (CrCl < 60 mL/min). IMS–IMWG: International Myeloma Society–International Myeloma Working Group; CrCl: creatinine clearance; β2M: β2-microglobulin.
Figure 2.
↓  Figure 3. Reclassification of prognostic groups according to the 2024 IMS–IMWG criteria and the CrCl-based criteria. The Sankey diagram illustrates changes in patient distribution when transitioning from the standard SCr-based definition (left) to a CrCl-based threshold of 60 mL/min (right). Flow colors represent sex (pink for female and blue for male), while nodes indicate prognostic groups defined by β2M and renal function. IMS–IMWG: International Myeloma Society–International Myeloma Working Group; SCr: serum creatinine; CrCl: creatinine clearance; β2M: β2-microglobulin.
Figure 3.

Tables

↓  Table 1. Baseline Characteristics
 
ParameterTotal, N = 250 (100%)Standard risk; group A, N = 109 (43.6%)Isolated high β2M; group B, N = 29 (11.6%)High β2M with renal impairment; group C, N = 112 (44.8%)P value
aDefined as a response of PR or better. bNo specified sites and numbers. SD: standard deviation; IQR: interquartile range; CrCl: creatinine clearance; GFR: glomerular filtration rate; β2M: β2-microglobulin; sCR: stringent complete response; CR: complete response; VGPR: very good partial response; ORR: objective response rate; PR: partial response; SD: stable disease; PD: progressive disease; ECOG: Eastern Cooperative Oncology Group.
Year of diagnosis, no. (%)
  2006–201055 (22.00)23 (21.10)11 (37.93)21 (18.75)0.354
  2011–201570 (28.00)35 (31.82)6 (20.69)29 (26.13)
  2016–2020102 (40.80)41 (37.27)11 (37.93)50 (45.05)
  2021–202323 (9.20)10 (9.09)1 (3.45)12 (10.81)
Age, years, ± SD60.98 ± 12.0859.89 ± 13.0662.07 ± 11.6461.77 ± 11.170.451
Sex, no. (%)
  Male155 (62.00)70 (64.22)8 (27.59)77 (68.75)< 0.001
  Female95 (38.00)39 (35.78)21 (72.41)35 (31.25)
Weight, kg, ± SD58.88 ± 12.0860.65 ± 12.3255.78 ± 10.1957.96 ± 12.110.085
ECOG, no. (%)
  0–1136 (54.40)71 (65.14)15 (51.72)50 (44.64)0.049
  274 (29.60)26 (23.85)7 (24.14)41 (36.61)
  329 (11.60)8 (7.34)6 (20.69)15 (13.39)
  411 (4.40)4 (3.67)1 (3.45)6 (5.36)
β2-microglobulin, mg/L (IQR)5.99 (3.75–12.16)3.47 (2.40–4.30)7.17 (5.78–9)12.64 (8.47–17.57)< 0.001
Creatinine, mg/dL (IQR)1.30 (0.90–2.32)0.92 (0.71–1.10)0.90 (0.73–0.97)2.54 (1.57–5.40)< 0.001
CrCl (Cockcroft-Gault Equation), mL/min (IQR)47.07 (21.58–68.52)62.12 (48.94–87.76)61.62 (47.90–76.50)19.53 (10.74–35.62)< 0.001
Estimated GFR (CKD-EPI 2021), mL/min/1.73 m2 (IQR)57.83 (28.24–86.67)82.90 (65.34–100.30)84.30 (68.77–96.93)22.62 (9.41–46.61)< 0.001
Albumin, mg/dL ± SD, n = 2493.43 ± 0.783.56 ± 0.693.27 ± 0.693.33 ± 0.860.050
High LDH, no. (%), n = 15358 (37.91)17 (26.15)11 (64.71)30 (42.25)0.009
High-risk cytogenetics, no. (%)
  No detection42 (16.80)19 (17.43)7 (24.14)16 (14.29)0.457
  t(4:14)6 (2.40)2 (1.83)0 (0.00)4 (3.57)
  Del(17p)7 (2.80)1 (0.92)1 (3.45)5 (4.46)
  Not done195 (78.00)87 (79.82)21 (72.41)87 (77.68)
International Staging System (ISS), no. (%)
  Stage I35 (14.00)35 (32.11)0 (0.00)0 (0.00)< 0.001
  Stage II74 (29.60)74 (67.89)0 (0.00)0 (0.00)
  Stage III141 (56.40)0 (0.00)29 (100.00)112 (100.00)
Hemoglobin, g/dL (IQR)8.9 (7.5–10.2)9.6 (8–11)9.2 (8–9.7)8.2 (6.9–9.4)< 0.001
Calcium, mg/dL (IQR)9.54 (9–10.69)9.37 (8.91–9.75)9.25 (8.8–9.6)10.1 (9.13–11.9)< 0.001
Induction regimen, no. (%)
  Bortezomib-based126 (50.40)52 (47.71)8 (27.59)66 (58.59)0.008
  Thalidomide-based72 (28.80)30 (27.52)12 (41.38)30 (26.79)0.282
  Lenalidomide-based5 (2.00)4 (3.67)0 (0.00)1 (0.89)0.260
  Daratumumab-based1 (0.40)0 (0.00)0 (0.00)1 (0.89)1.000
Type of induction regimen, no. (%)
  Palliative care/steroid monotherapy15 (6.00)7 (6.42)2 (6.90)6 (5.36)0.122
  Doublet84 (33.60)31 (28.44)16 (55.17)37 (33.04)
  Triplet130 (52.00)58 (53.21)10 (34.48)62 (55.36)
  Quadruplet1 (0.40)0 (0.00)0 (0.00)1(0.89)
  Chemotherapy20 (8.00)13 (11.93)1 (3.45)6 (5.36)
Best response after induction, no. (%), n = 218
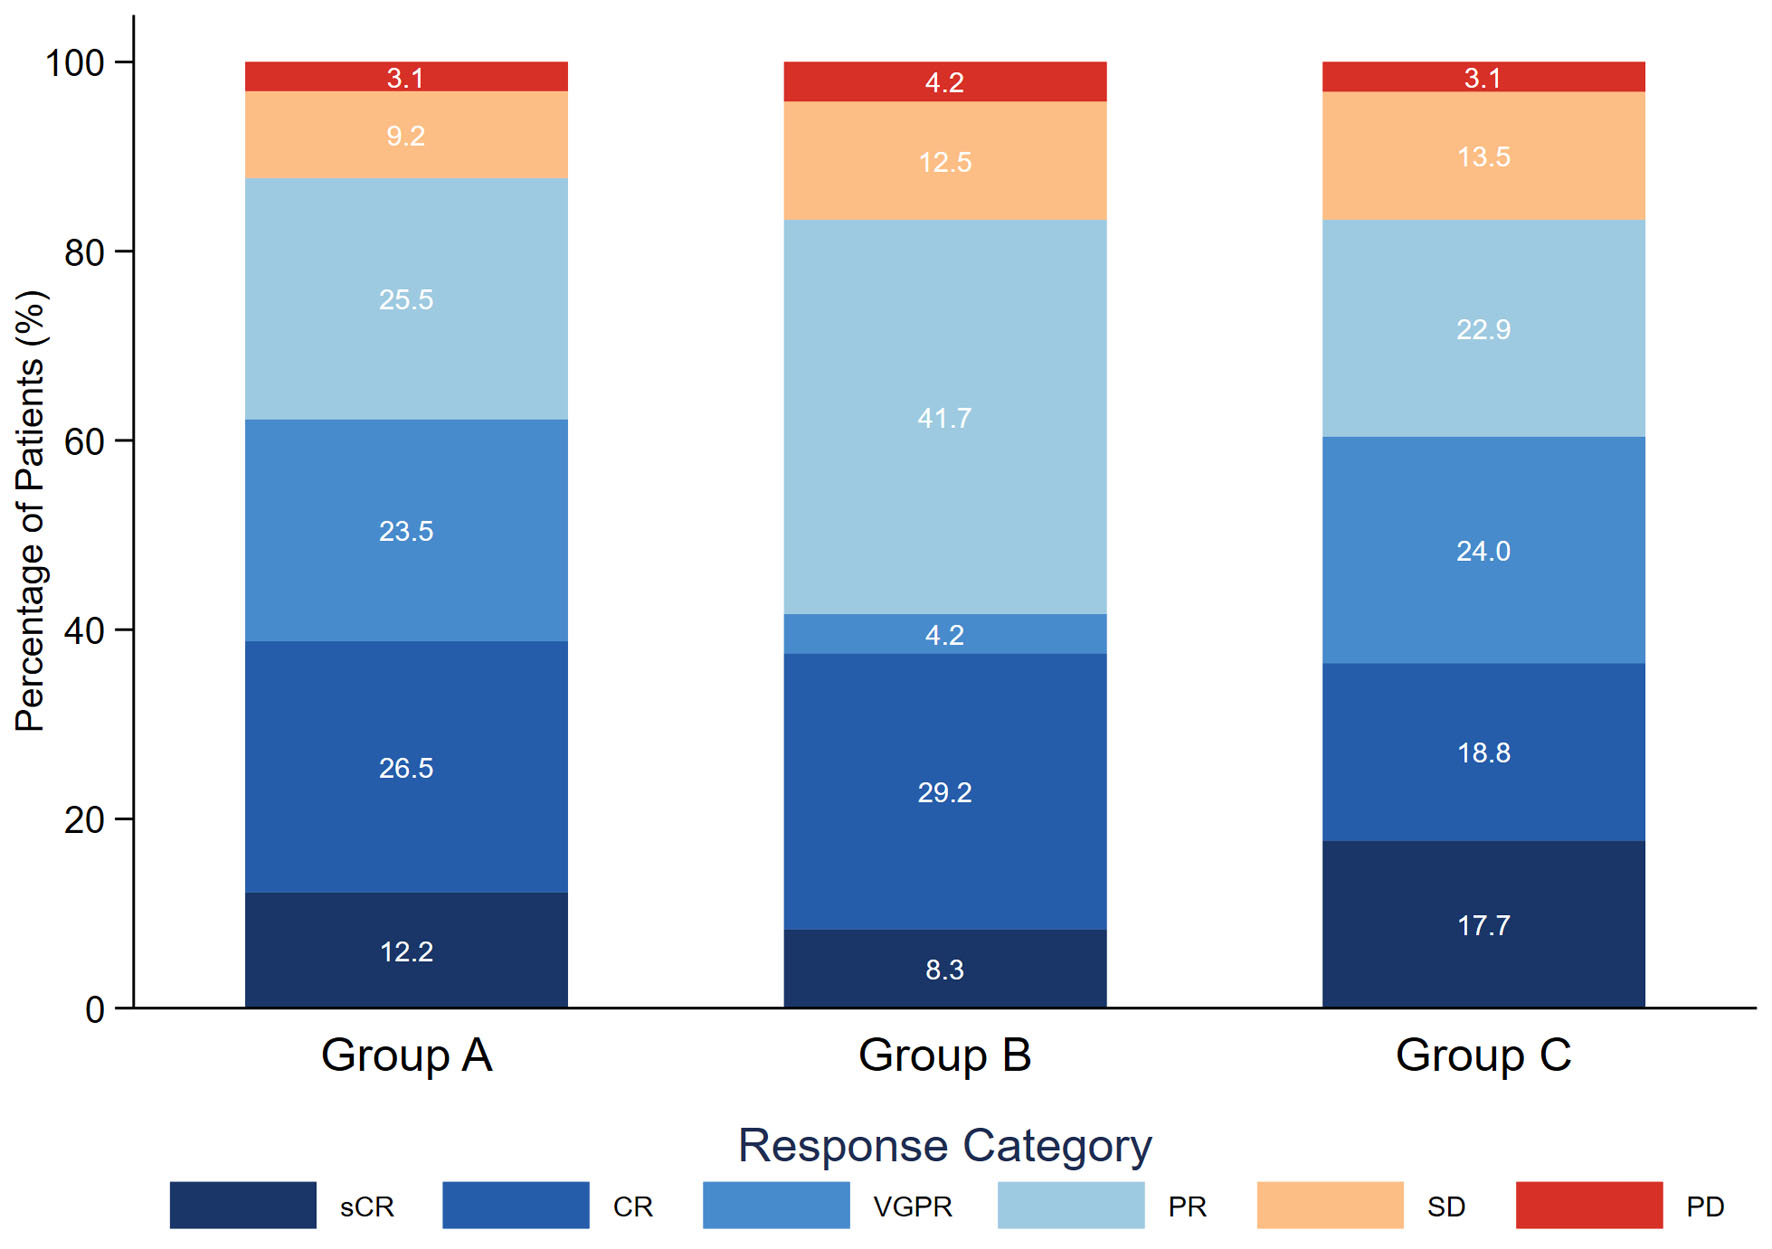
  sCR31 (14.22)12 (12.24)2 (8.33)17 (17.71)0.388
  CR51 (23.39)26 (26.53)7 (29.17)18 (18.75)
  VGPR47 (21.56)23 (23.47)1 (4.17)23 (23.96)
  PR57 (26.15)25 (25.51)10 (41.67)22 (22.92)
  SD25 (11.47)9 (9.18)3 (12.50)13 (13.54)
  PD7 (3.21)3 (3.06)1 (4.17)3 (3.13)
ORRa, no. (%), n = 218186 (85.32)86 (87.76)20 (83.33)80 (83.33)0.630
Plasmacytomab, no. (%)83 (33.20)41 (37.61)12 (41.38)30 (26.79)0.141
ASCT, no. (%)86 (34.40)42 (38.53)7 (24.14)37 (33.04)0.346
Mortality, no. (%)89 (35.60)32 (29.36)11 (37.93)46 (41.07)0.192


↓  Table 2. Univariable and Multivariable Cox Regression Analyses for Overall Survival and Progression-Free Survival Stratified by β2M and SCr
 
Prognostic groupOverall survivalProgression-free survival
Crude HR (95% CI)PAdjusted HR (95% CI)aPCrude HR (95% CI)PAdjusted HR (95% CI)aP
aAdjusted for age, sex, bortezomib-based regimens, ASCT status, Eastern Cooperative Oncology Group performance status (≥ 2), and presence of plasmacytoma. HR: hazard ratio; CI: confidence interval; β2M: β2-microglobulin; SCr: serum creatinine; ASCT: autologous stem cell transplantation.
Group A (standard)1.00 (Ref)-1.00 (Ref)-1.00 (Ref)-1.00 (Ref)-
Group B (isolated high β2M)1.64 (0.82–3.26)0.1591.51 (0.70–3.24)0.2911.53 (0.98–2.39)0.0641.37 (0.86–2.20)0.187
Group C (high β2M and impaired renal function)1.96 (1.24–3.09)0.0041.79 (1.11–2.86)0.0161.38 (1.03–1.85)0.0331.31 (0.96–1.79)0.091
Comparison group B vs. C0.84 (0.43–1.62)0.5960.85 (0.40–1.81)0.6671.11 (0.71–1.73)0.6471.05 (0.64–1.71)0.851


↓  Table 3. Univariable and Multivariable Cox Regression Analyses for Overall Survival and Progression-Free Survival Stratified by β2M and CrCl
 
Prognostic groupOverall survivalProgression-free survival
Crude HR (95% CI)PAdjusted HR (95% CI)aPCrude HR (95% CI)PAdjusted HR (95% CI)aP
aAdjusted for age, sex, bortezomib-based regimens, ASCT status, Eastern Cooperative Oncology Group performance status (≥ 2), and presence of plasmacytoma. HR: hazard ratio; CI: confidence interval; β2M: β2-microglobulin; CrCl: creatinine clearance; ASCT: autologous stem cell transplantation.
Group A (standard)1.00 (Ref)-1.00 (Ref)-1.00 (Ref)-1.00 (Ref)-
Group B (isolated high β2M)2.23 (1.02–4.88)0.0442.61 (1.17–5.86)0.0201.47 (0.85–2.55)0.1721.39 (0.80–2.44)0.243
Group C (high β2M and impaired renal function)1.84 (1.17– 2.88)0.0081.63 (1.02–2.59)0.0401.40 (1.05–1.86)0.0231.31 (0.97–1.79)0.078
Comparison group B vs. C1.21 (0.57–2.57)0.6121.61 (0.73–3.53)0.2391.05 (0.61– 1.81)0.8571.06 (0.60–1.86)0.835