Figures
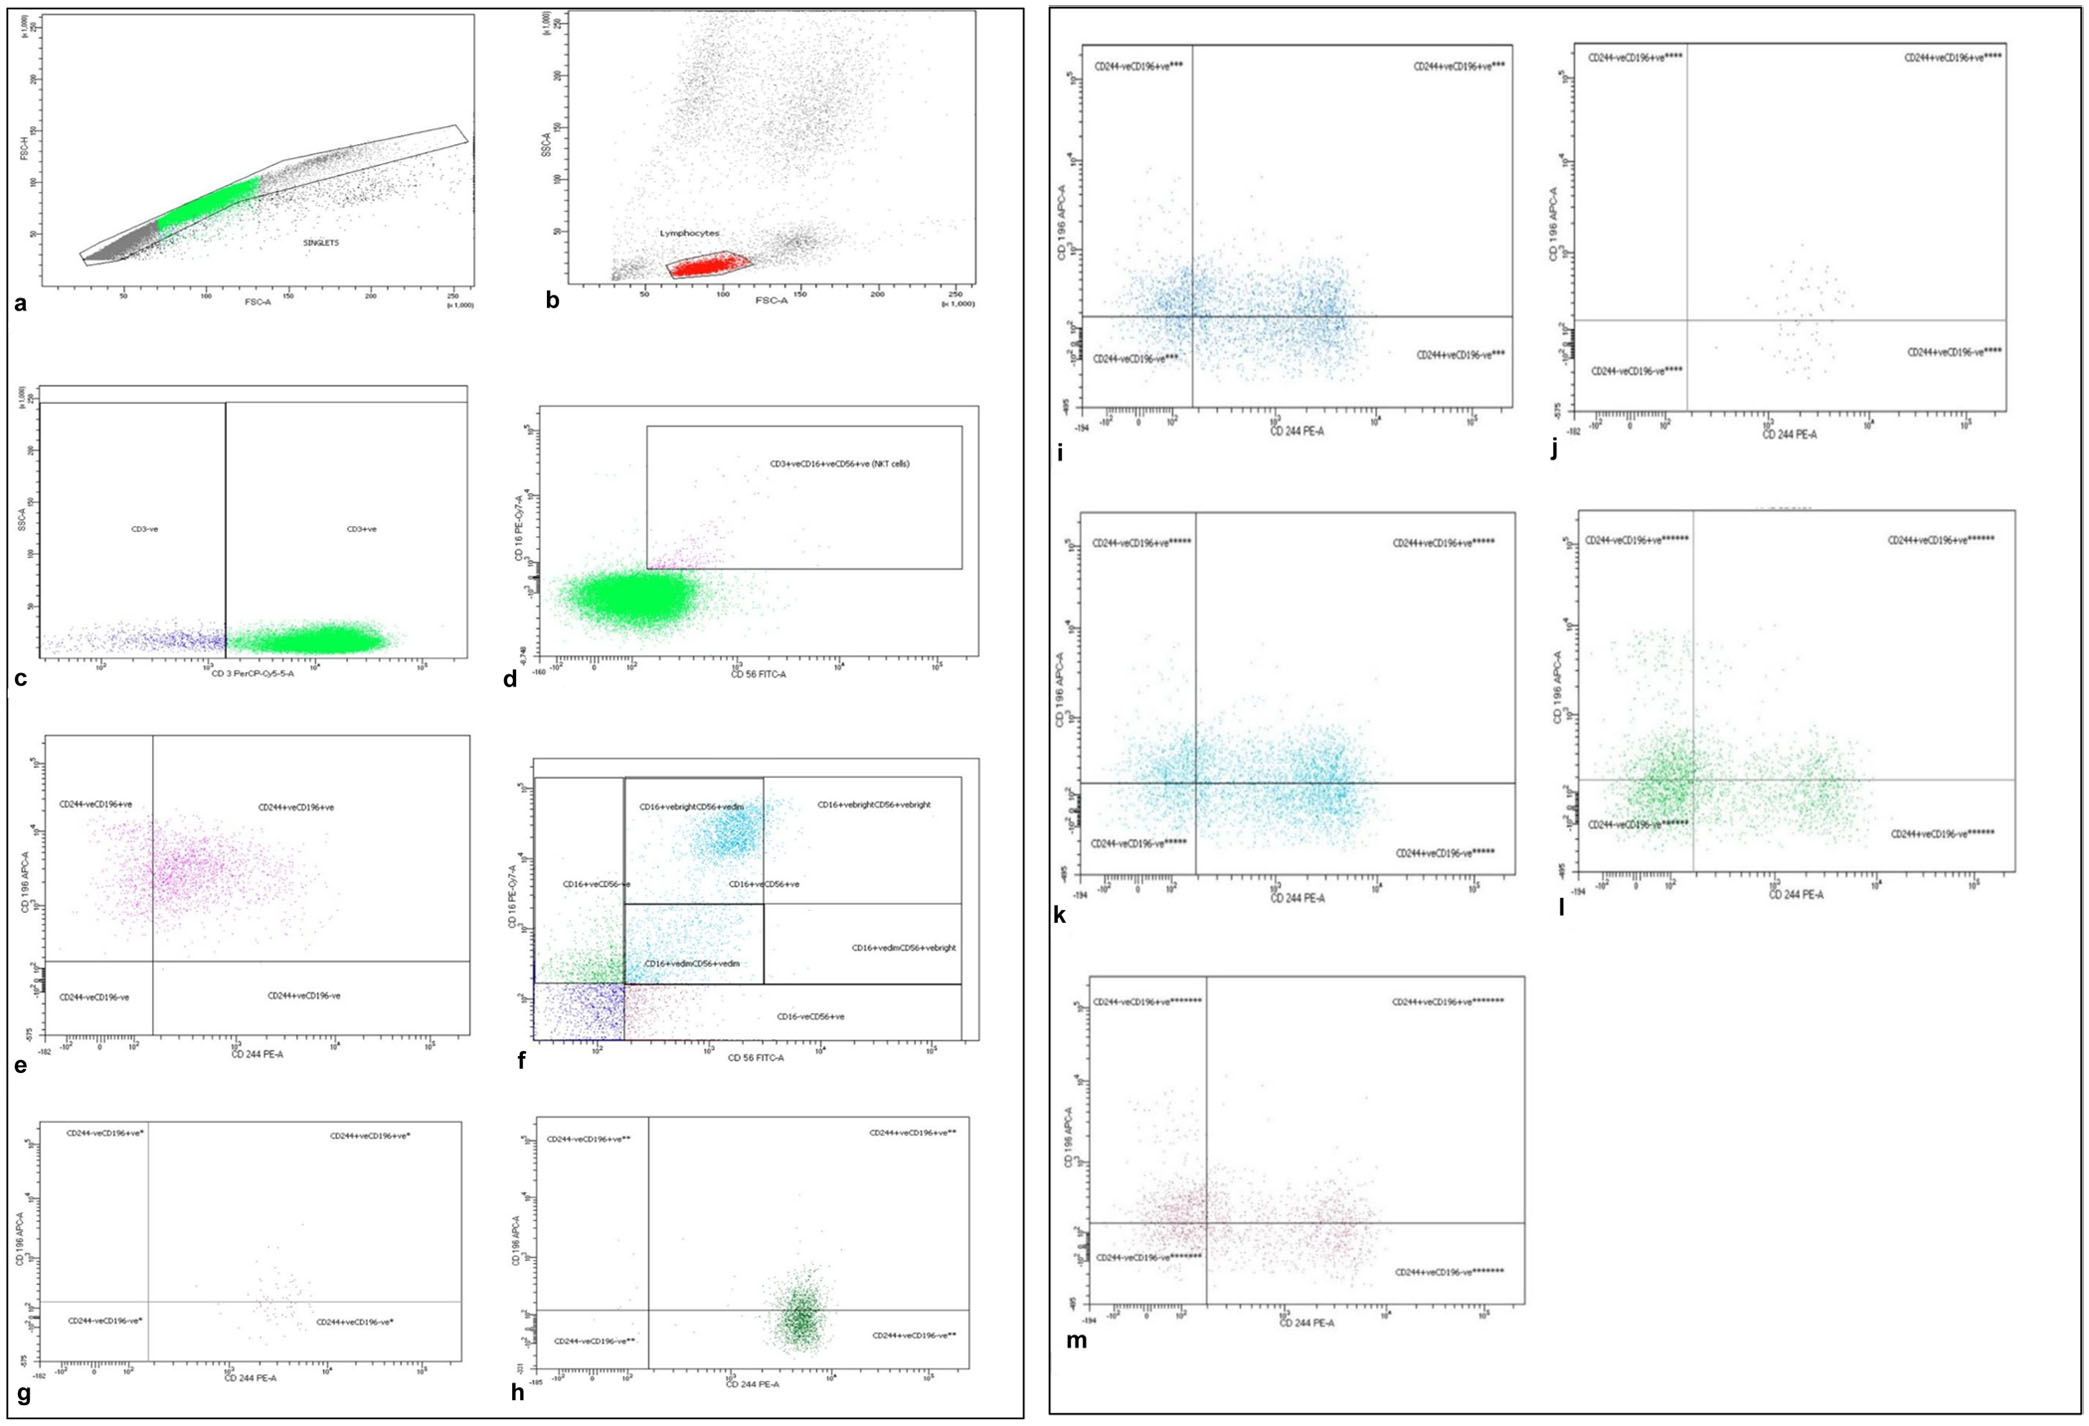
↓ Figure 1. Flow cytometric detection of lymphocytes, NK cells, NKT cells, and their expression of CD196 and CD244. (a) Forward scatter area and height to define singlets and exclude duplicates. (b) Forward and side scatter dot plot was used to define lymphocyte population. (c) The expression of CD3 on lymphocyte population to detect CD3+ and CD3− lymphocytes. (d) The expression of CD16 and CD56 on CD3+ lymphocyte population to detect CD3+CD16+CD56+ NKT cells. (e) The expression of CD196 and CD244 on CD3+CD16+CD56+ NKT cells. (f) The expression of CD16 and CD56 on CD3− population to detect different NK cell subtypes according to the positivity or negativity, dimness, or brightness of CD16 and CD56. (g) The expression of CD196 and CD244 on CD3−CD16+brightCD56+bright NK cells. (h) The expression of CD196 and CD244 on CD3−CD16+brightCD56+dim NK cells. (i) The expression of CD196 and CD244 on CD3−CD16+dimCD56+dim NK cells. (j) The expression of CD196 and CD244 on CD3−CD16+dimCD56+bright NK cells. (k) The expression of CD196 and CD244 on total CD3−CD16+CD56+ NK cells. (l) The expression of CD196 and CD244 on CD3−CD16+CD56− population. (m) The expression of CD196 and CD244 on CD3−CD16−CD56+ population.
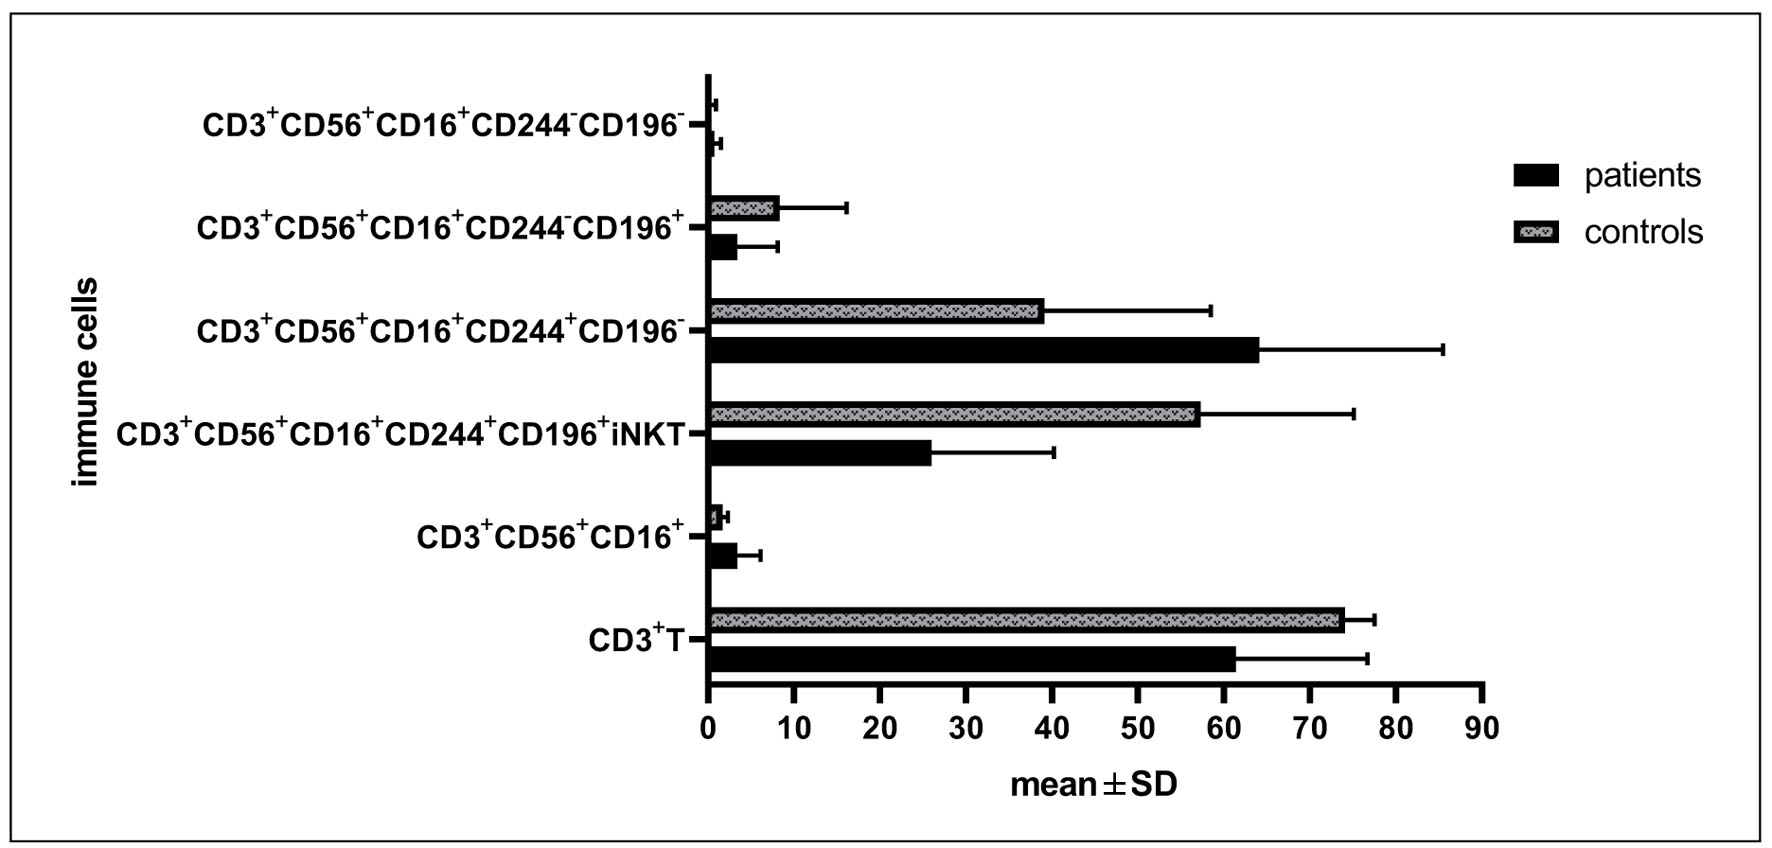
↓ Figure 2. Differential expressions of CD244 and CD196 on CD3+CD56+CD16+ cells between AML patients and healthy controls, Mann–Whitney test.
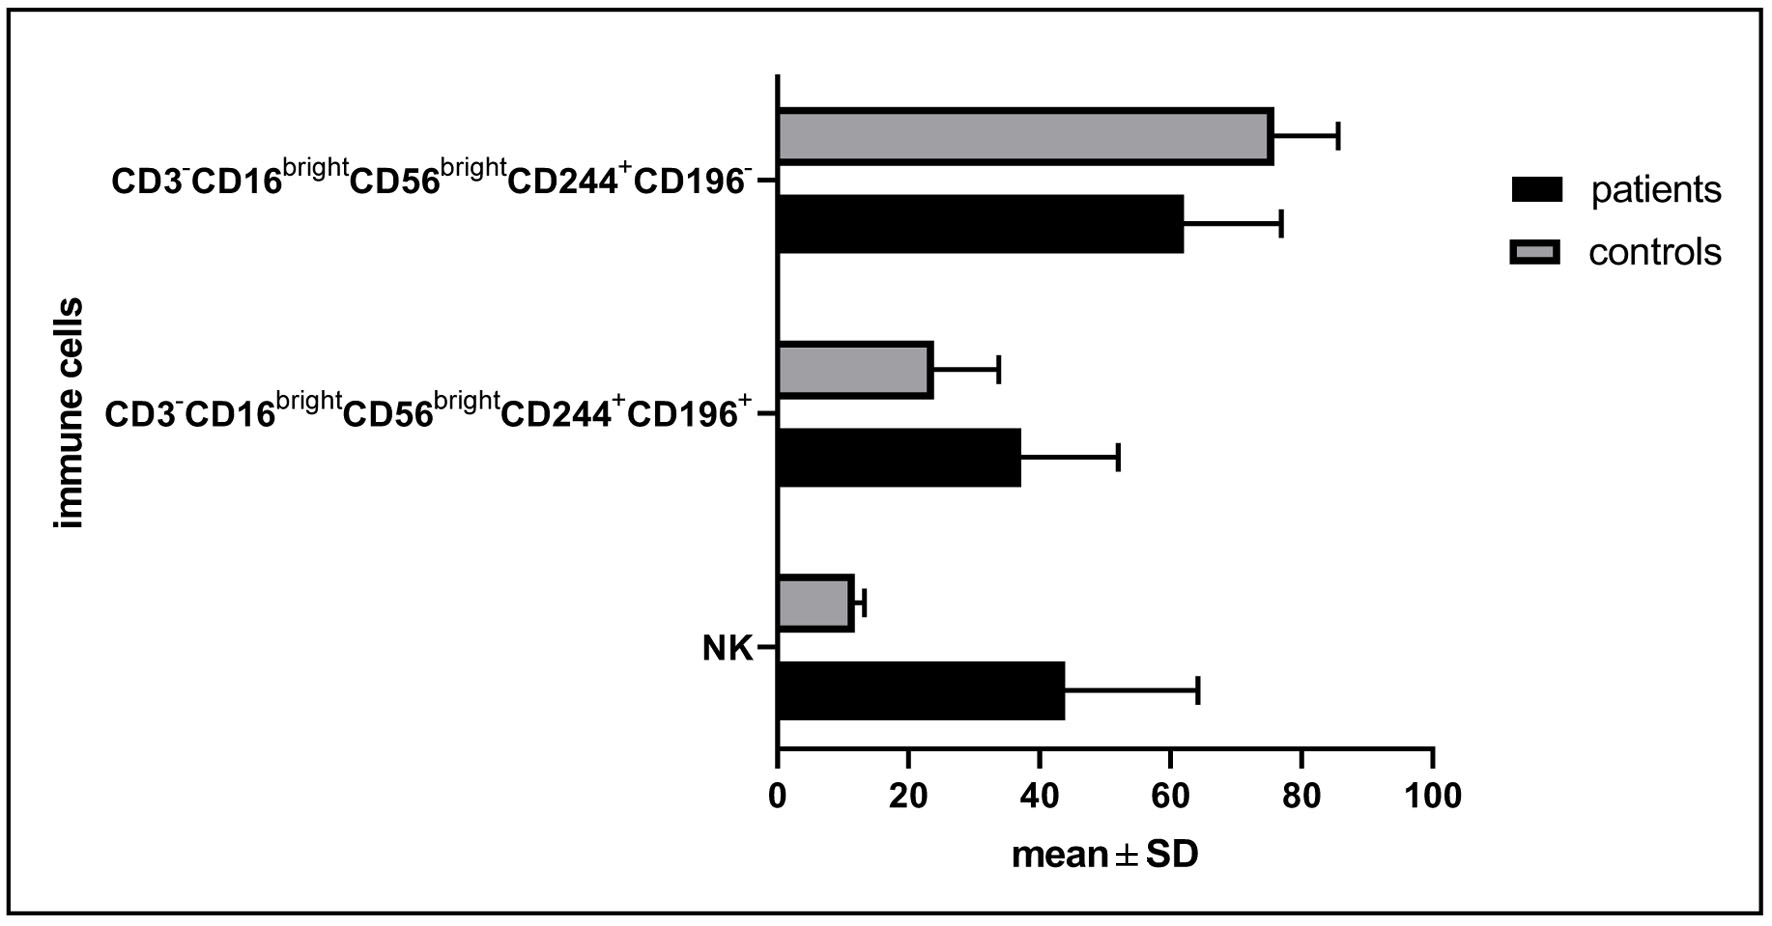
↓ Figure 3. Differential expression of CD244 and CD196 on CD56brightCDbright cells between patients and controls.
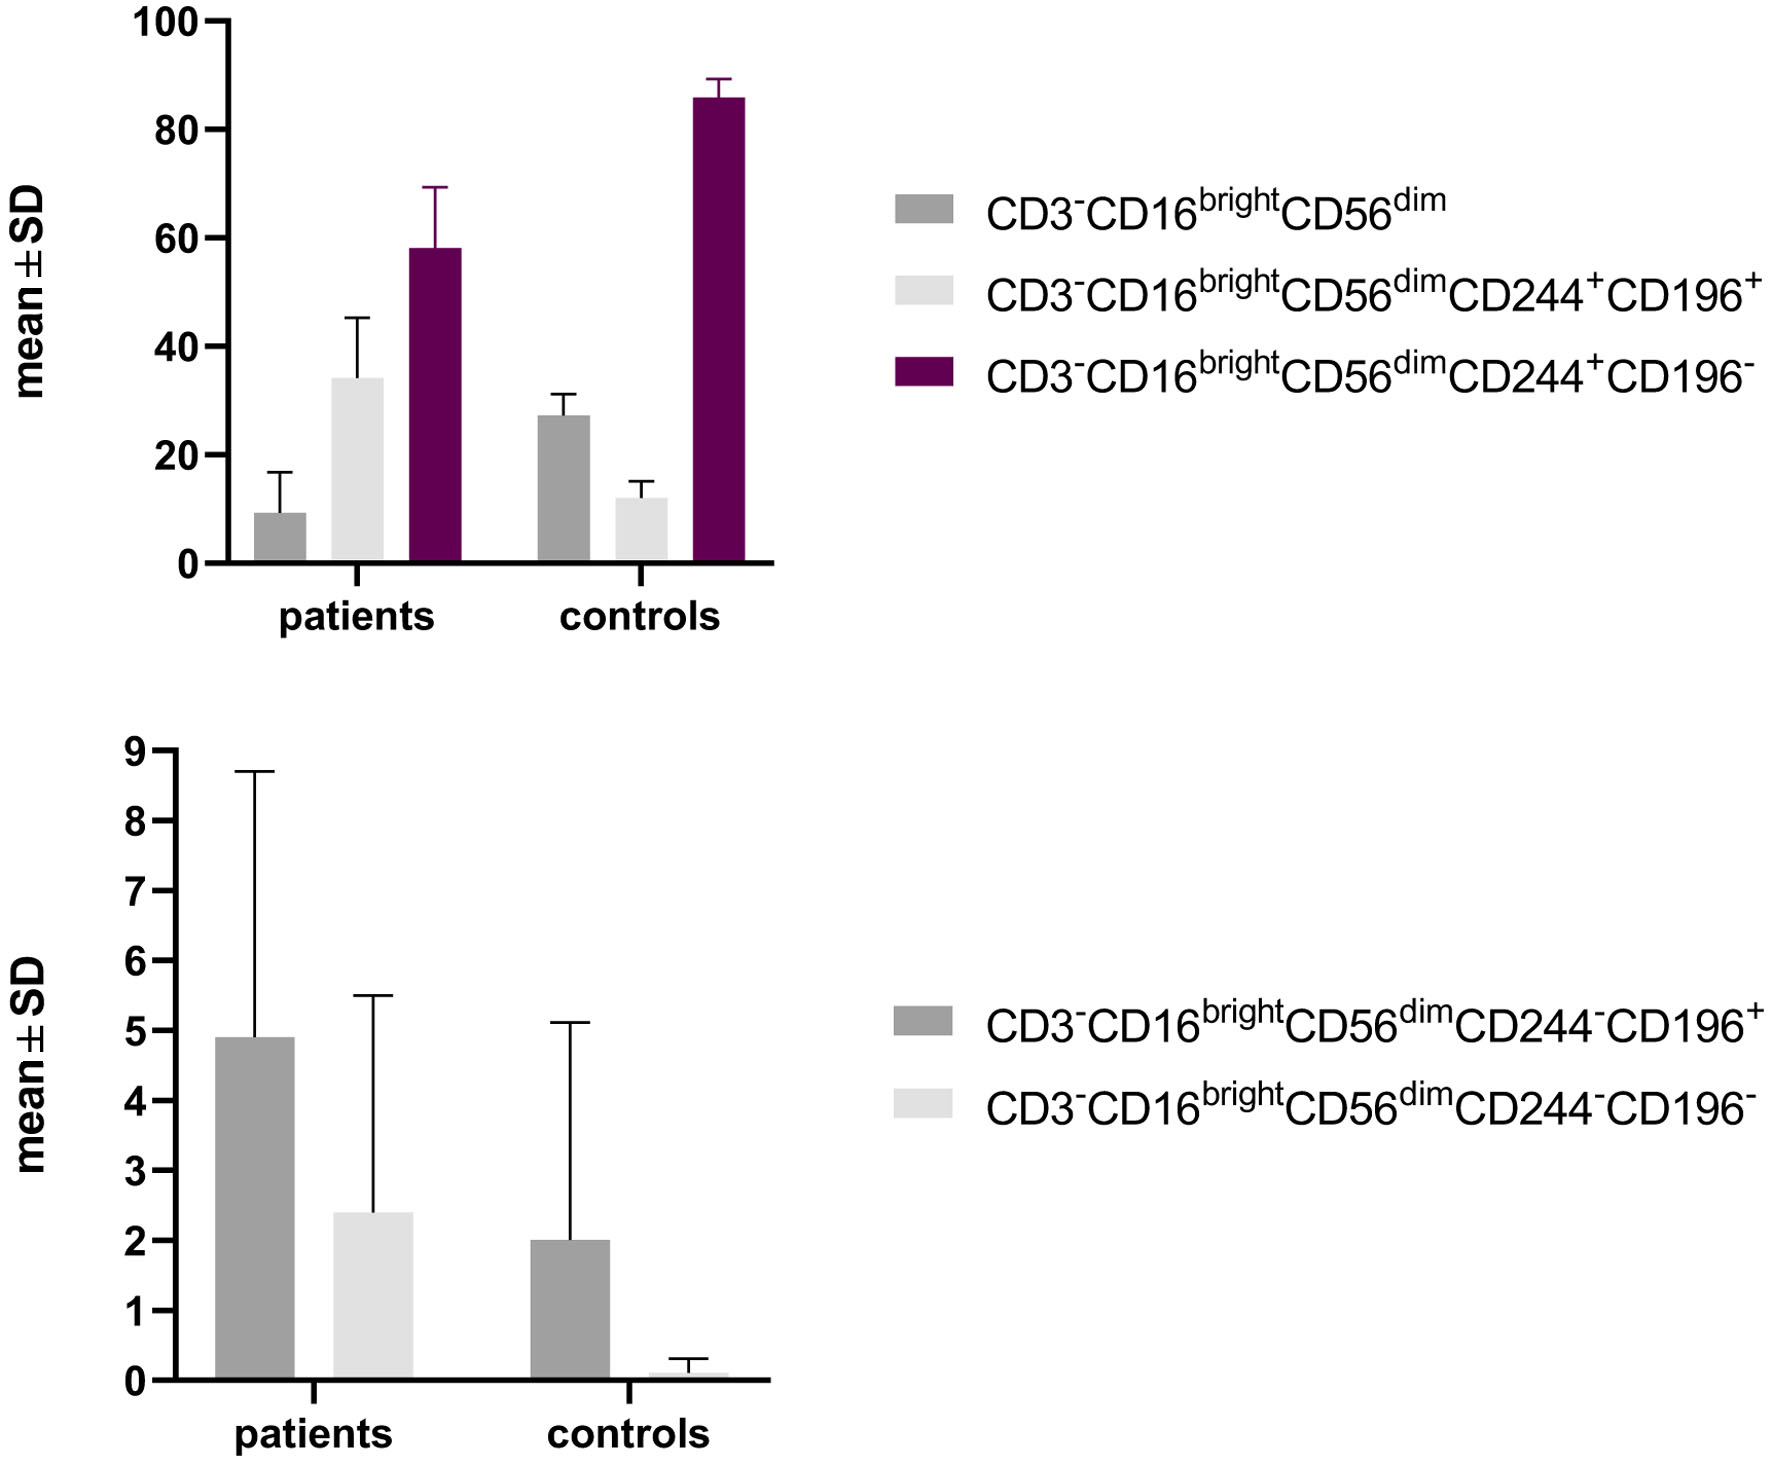
↓ Figure 4. Differential expression of CD16brightCD56dim between patients and controls with CD244 and CD196 expression.
↓ Figure 5. Differential expression of CD3−CD16+CD56− subpopulations between patients and controls.
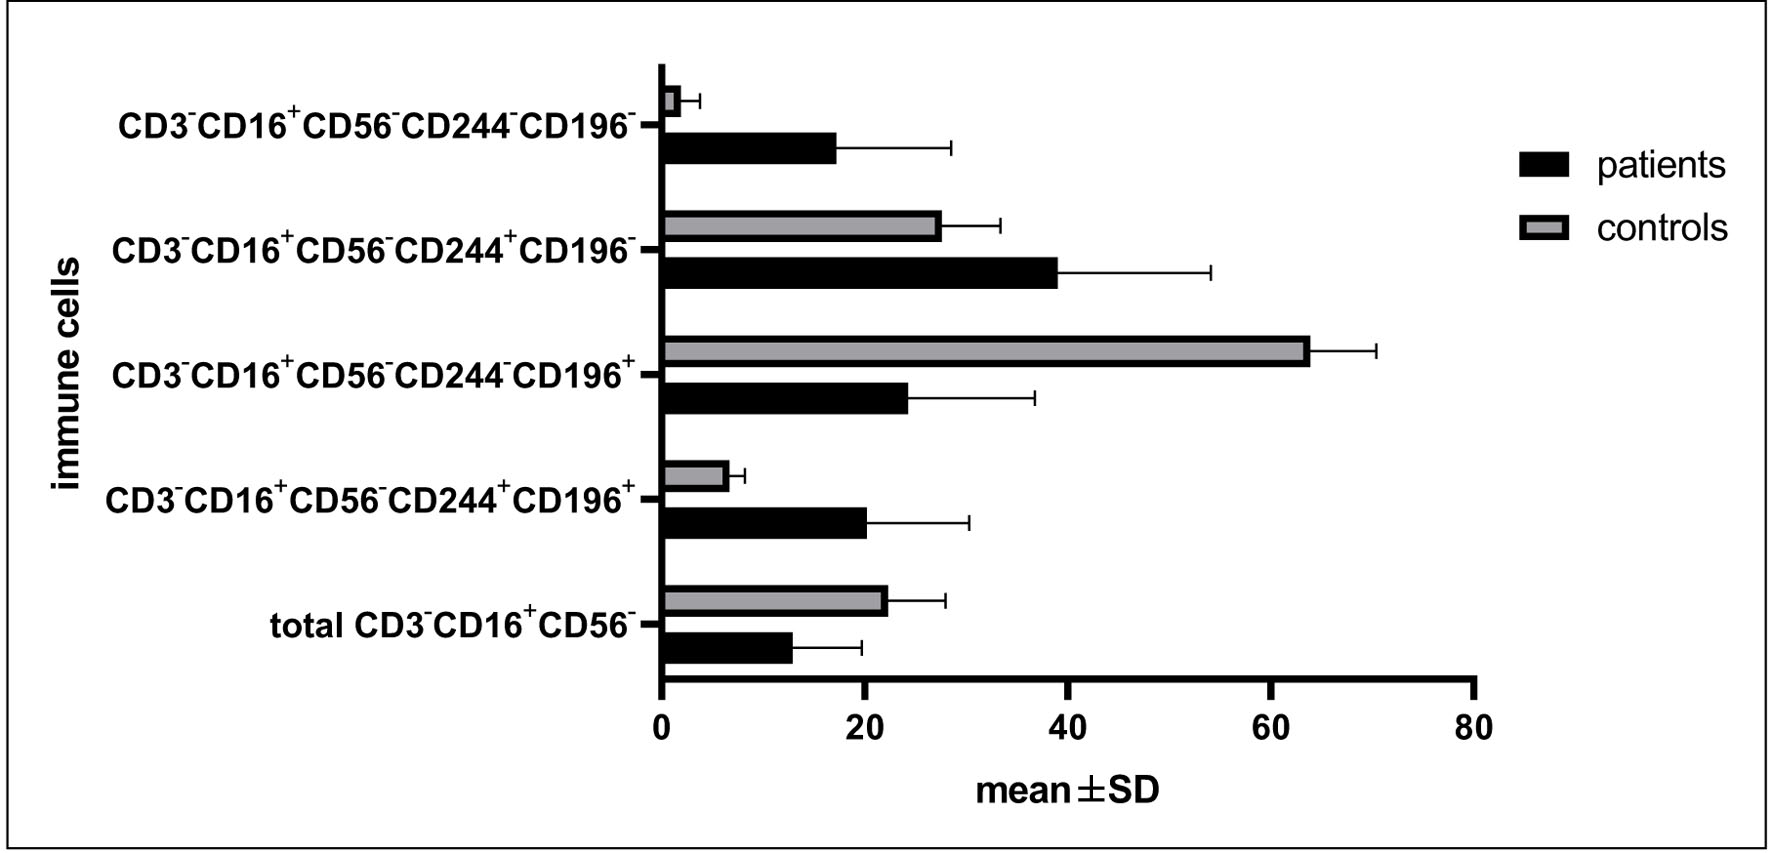
↓ Figure 6. Differential expression of CD3−CD16−CD56+ subpopulations between patients and controls.
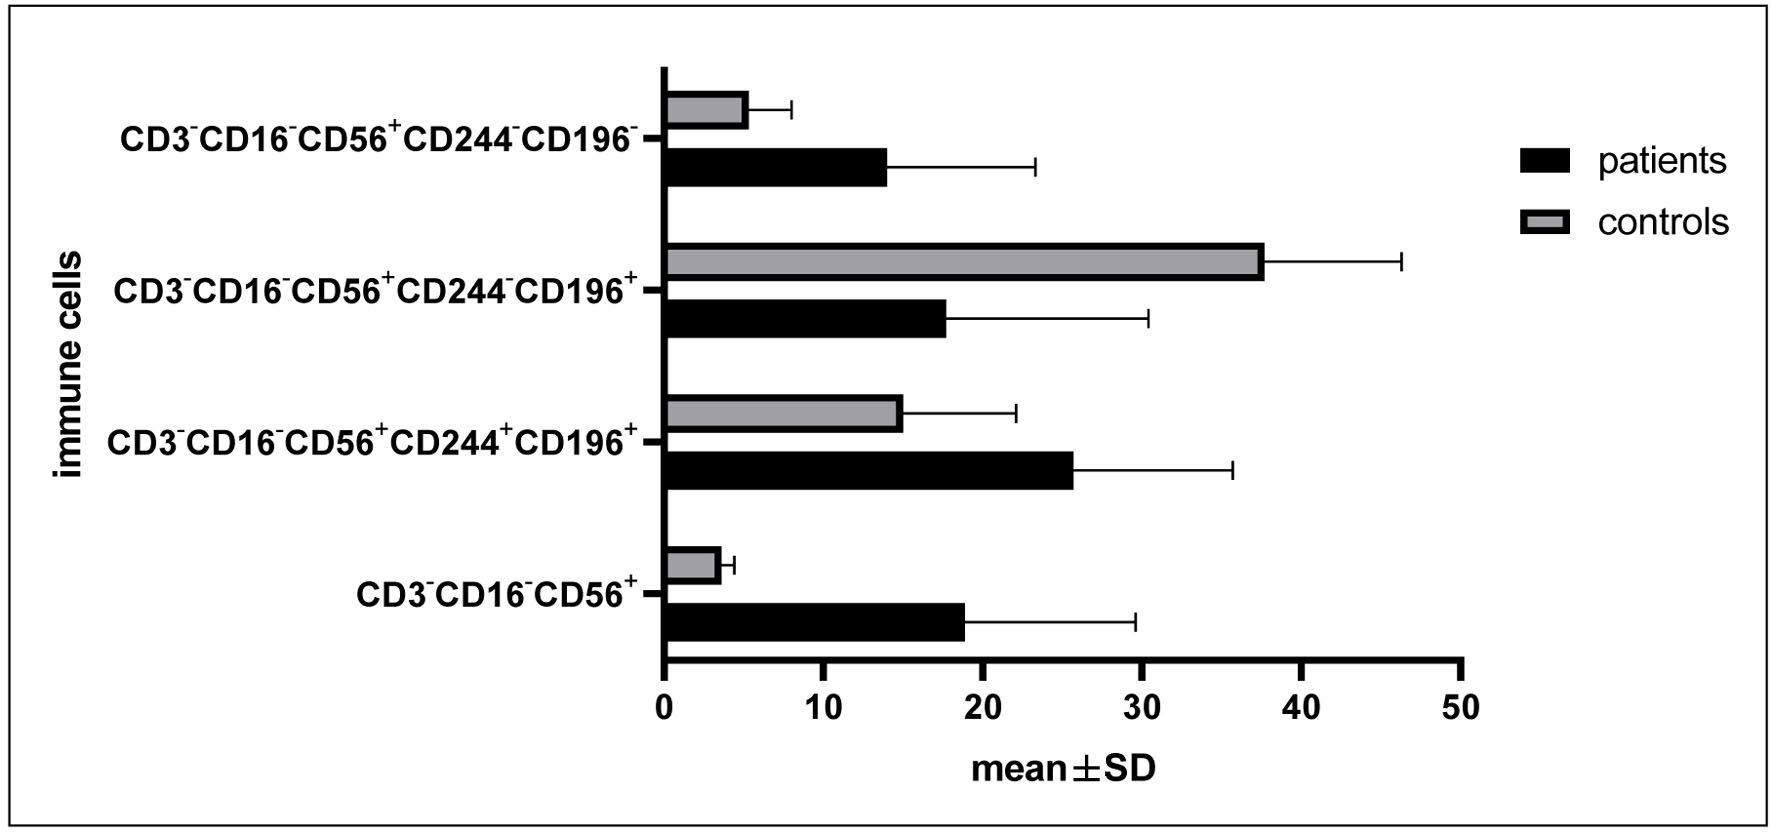
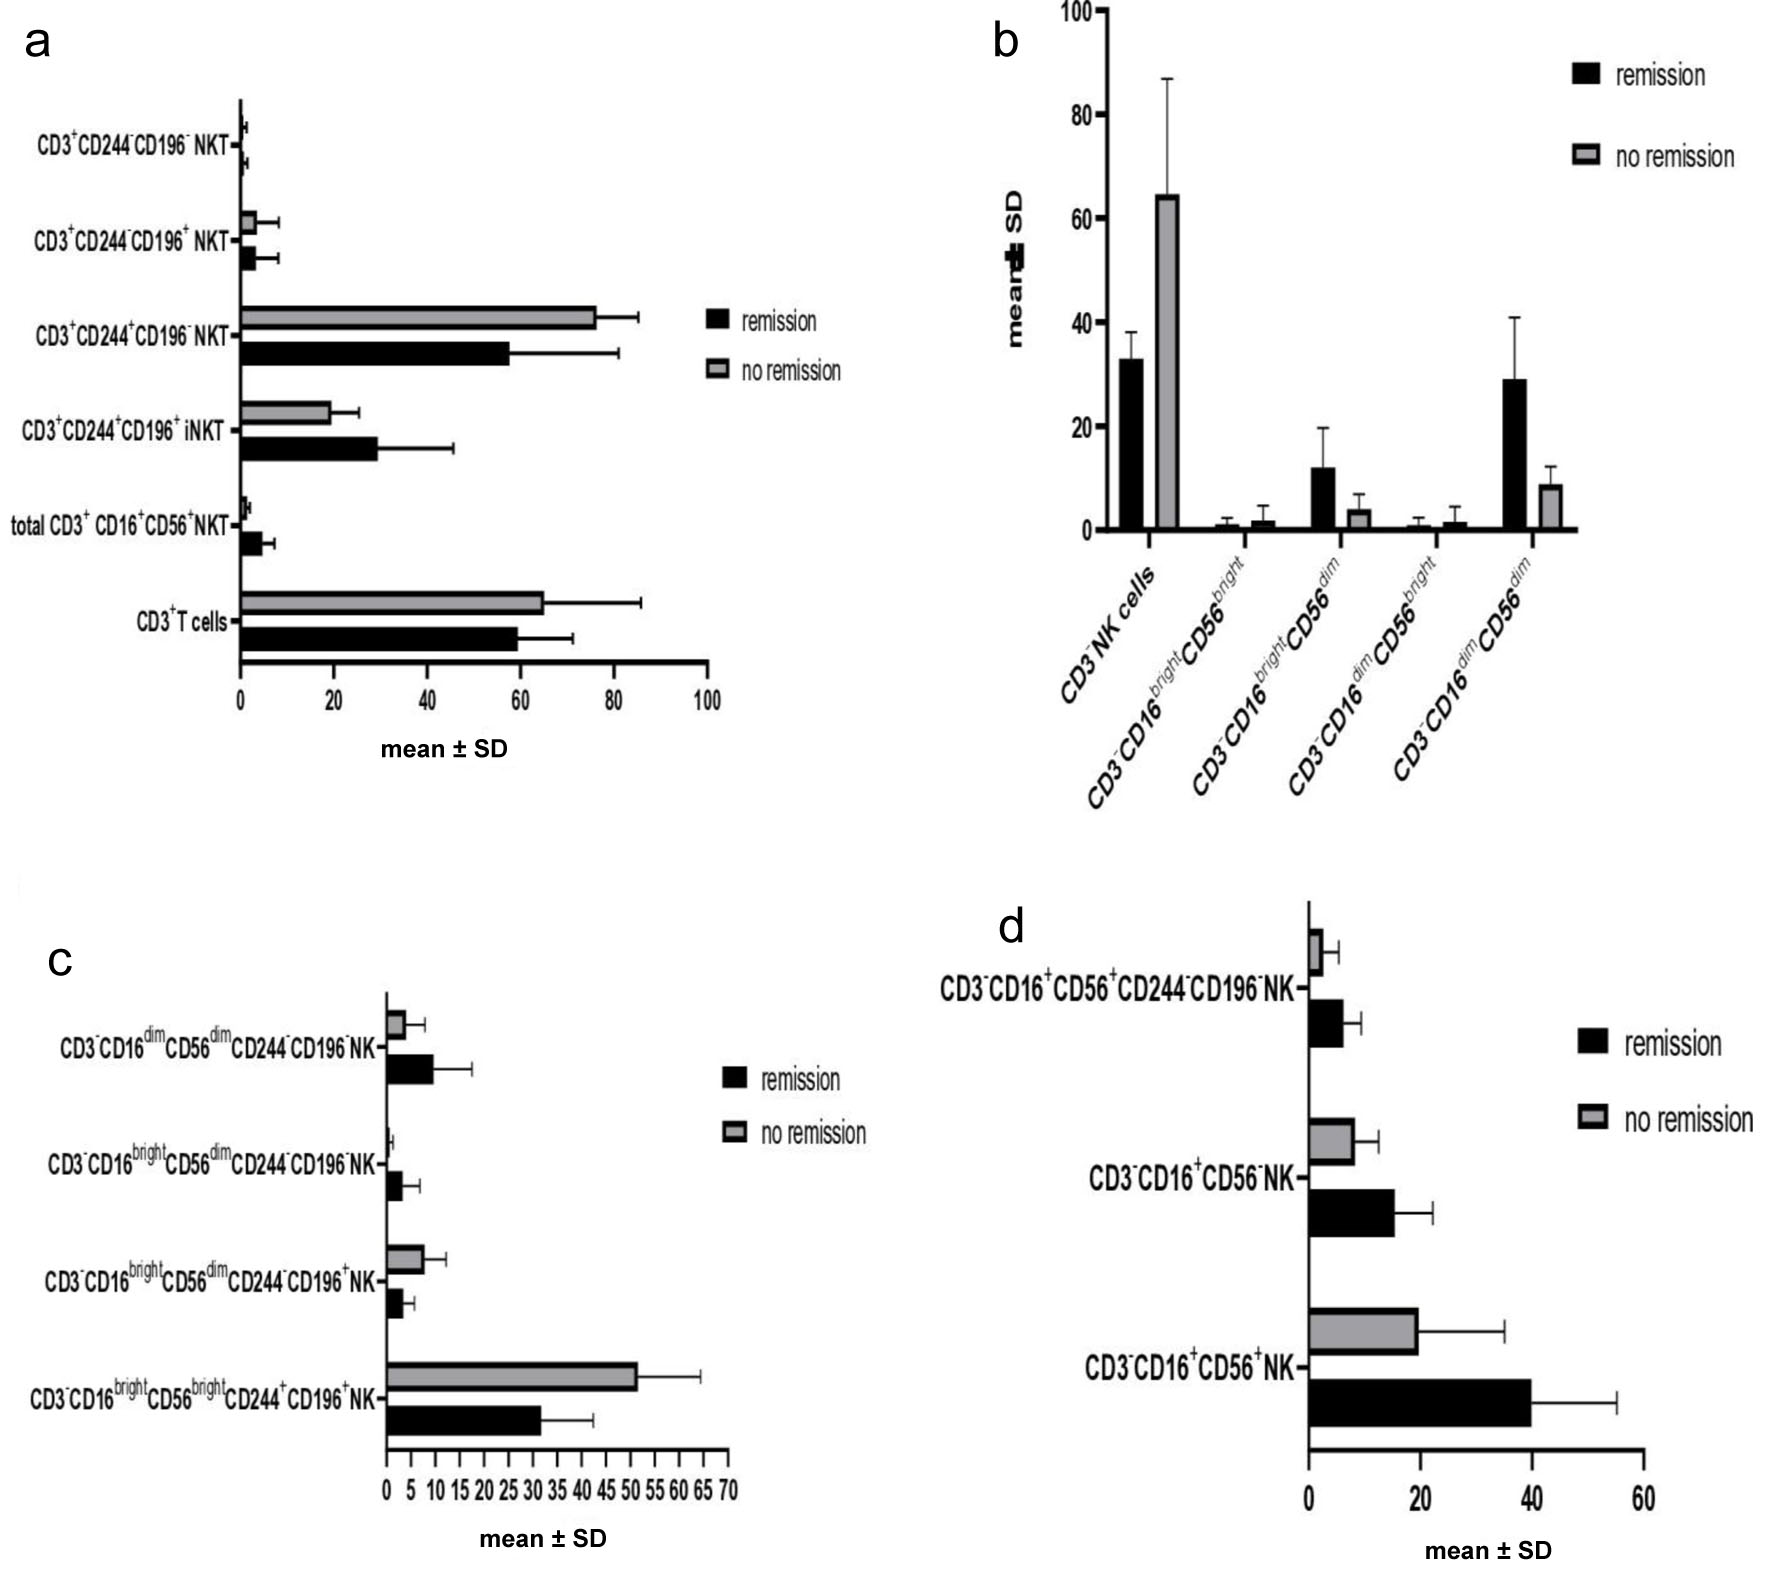
↓ Figure 7. (a) Differential expression of NKT subpopulations according to remission. (b) Differential expression of NK subpopulations. (c) Differential expression of CD244 and CD196 on NK subpopulations. (d) Differential expression of CD16 and CD56 on NK cells according to remission.
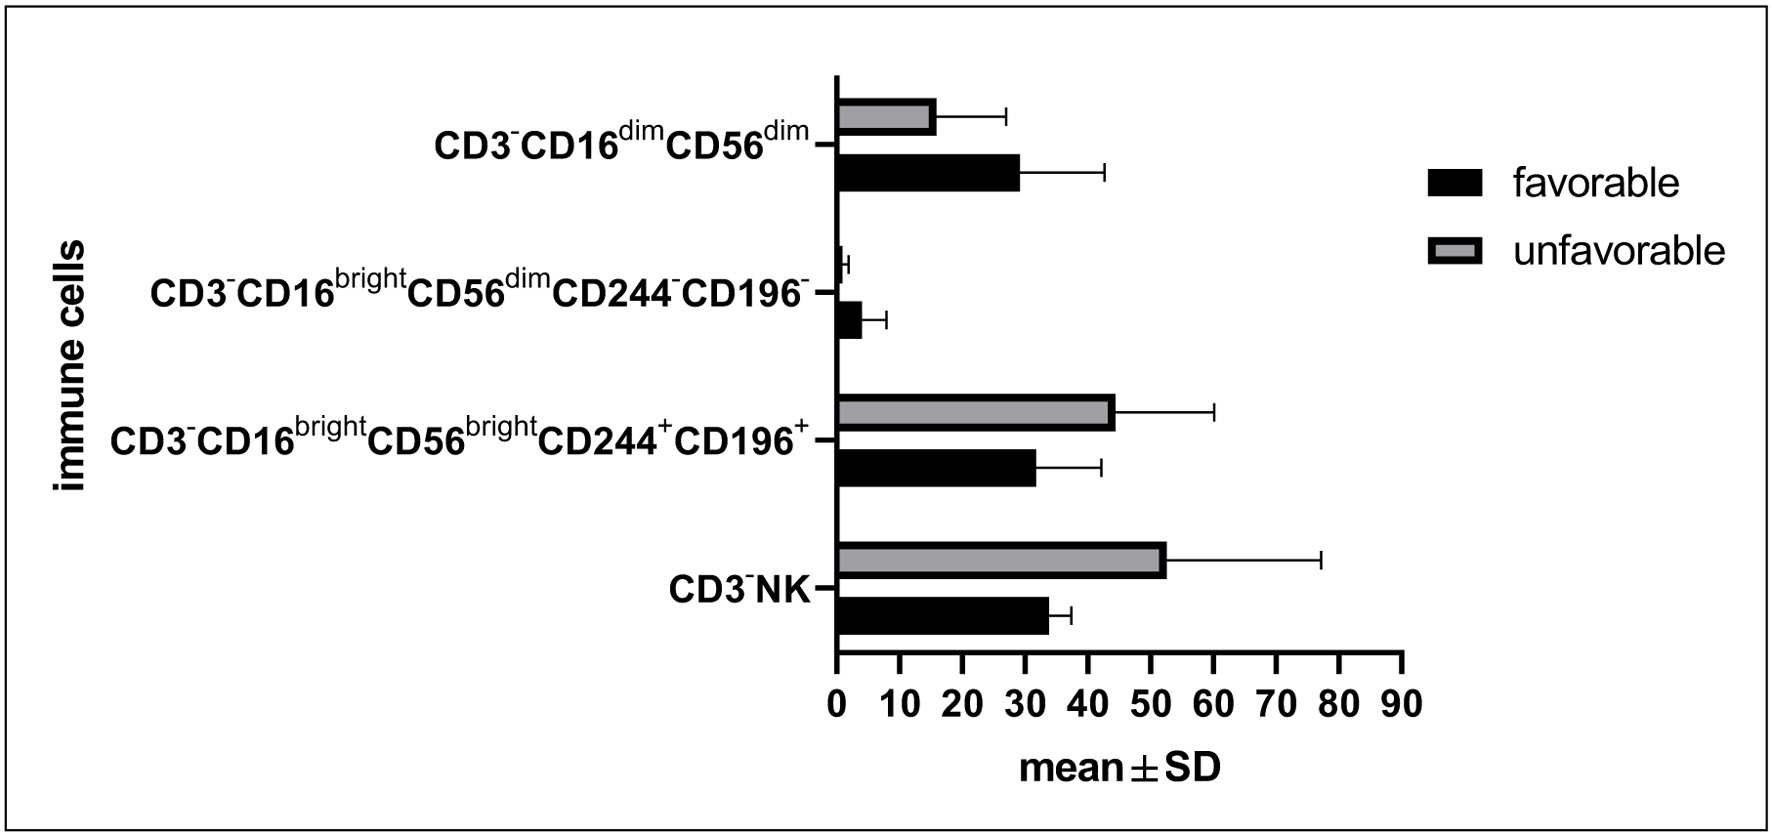
↓ Figure 8. Differential expression of immune cells according to cytogenetics.
Tables
↓ Table 1. Demographic Data of Study Population
| Demographic | Patients (n = 26) | Controls (n = 24) | P-value |
|---|
| Data are expressed as mean ± SD, median, number, and percentages. aMann–Whitney test. bFisher’s exact test. P ≤ 0.05 is considered significant. SD: standard deviation. |
| Agea | | | 0.6 |
| Mean ± SD | 45.5 ± 18.1 | 47.6 ± 6.7 | |
| Median | 46 years | 47 years | |
| Sexb | | | 0.7 |
| Male (n = 31) | 17 (54.8%) | 14 (45.2%) | |
| Female (n = 19) | 9 (47.4%) | 10 (52.6%) | |
↓ Table 2. Laboratory Characteristics of AML Patients
| Characteristics | Descriptive |
|---|
| Data are expressed as mean ± SD, numbers, and percentages. AML: acute myelocytic leukemia; CRP: C-reactive protein; DIC: disseminated intravascular coagulation; Hb: hemoglobin; LDH: lactate dehydrogenase; SD: standard deviation; WBC: white blood cell. |
| Hb (mean ± SD) | 8.1 ± 1.4 |
| WBCs (mean ± SD) | 74.9 ± 77.5 |
| Lymphocytic count (mean ± SD) | 15.9 ± 6.1 |
| Neutrophilic count (mean ± SD) | 24.3 ± 13.1 |
| Platelet count (mean ± SD) | 48.14 ± 38.8 |
| LDH (mean ± SD) | 929.3 ± 735.6 |
| Uric acid (mean ± SD) | 9.6 ± 4.8 |
| Serum ferritin (mean ± SD) | 606.1 ± 643.04 |
| CRP (mean ± SD) | 46.4 ± 54.8 |
| Peripheral blasts % (mean ± SD) | 52.9 ± 19.5 |
| BM blasts % (mean ± SD) | 57.7 ± 19.8 |
| Impaired liver function | 10 (38.5%) |
| Raised renal function | 6 (23.1%) |
| DIC, % | 4 (15.4%) |
| Decreased fibrinogen level, % | 6 (23.1%) |
| Raised D-dimer, % | 5 (19.2%) |
| Impaired coagulation, % | 5 (19.2%) |
↓ Table 3. AML Types, Cytogenetics, Molecular Genetics, and Risk Groups
| Characteristics | Frequencies |
|---|
| Data are expressed as numbers and percentages. AML: acute myelocytic leukemia; FAB: French-American-British. |
| AML type | |
| Primary | 23 (88.5%) |
| Secondary | 3 (11.5%) |
| FAB types | |
| M1 | 2 (7.7%) |
| M2 | 1 (3.8%) |
| M1/M2 | 4 (15.4%) |
| M4 | 2 (7.7%) |
| M4/M5 | 14 (53.8%) |
| M5 | 3 (11.5%) |
| Cytogenetics | |
| Favorable | 12 (46.2%) |
| Unfavorable | 14 (53.8%) |
| Molecular genetics | |
| Positive FLT3 | 9 (34.6%) |
| Positive CD117 | 8 (30.8%) |
| Positive NPM1 | 8 (30.8%) |
↓ Table 4. Differential Expression of CD244 and CD196 on CD3−CD16dimCD56bright NK Cells Between Patients and Controls
| CD3−CD16dimCD56bright subpopulations | Group | Mean% ± SD | P-value |
|---|
| Data are expressed as mean % ± SD and analyzed by Mann–Whitney test. P ≤ 0.05 is significant. |
| CD3−CD16dimCD56bright | Patients | 1.1 ± 2.1 | 0.6 |
| Controls | 0.9 ± 0.4 | |
| CD3−CD16dimCD56brightCD244+CD196+ | Patients | 26.7 ± 25.2 | 0.016 |
| Controls | 12.2 ± 11.3 | |
| CD3−CD16dimCD56brightCD244+CD196− | Patients | 38.4 ± 28.8 | < 0.001 |
| Controls | 80.3 ± 8.2 | |
| CD3−CD16dimCD56brightCD244−CD196− | Patients | 0.09 ± 0.4 | 0.4 |
| Controls | 0.01 ± 0.0 | |
| CD3−CD16dimCD56brightCD244−CD196+ | Patients | 0.4 ± 1.3 | 0.9 |
| Controls | 0.3 ± 1.1 | |
↓ Table 5. Differential Expression of CD244 and CD196 on CD3−CD16dimCD56dim NK Cells Between Patients and Controls
| CD3−CD16dimCD56dim subpopulations | Group | Mean % ± SD | P-value |
|---|
| Data are expressed as mean % ± SD and analyzed by Mann–Whitney test. P ≤ 0.05 is significant. |
| CD3−CD16dimCD56dim | Patients | 22.02 ± 13.8 | < 0.001 |
| Controls | 5.7 ± 2.6 | |
| CD3−CD16dimCD56dimCD244+CD196+ | Patients | 33.1 ± 11.6 | < 0.001 |
| Controls | 18.4 ± 7.2 | |
| CD3−CD16dimCD56dimCD244+CD196− | Patients | 46.6 ± 19.0 | 0.3 |
| Controls | 54.4 ± 18.2 | |
| CD3−CD16dimCD56dimCD244−CD196+ | Patients | 12.6 ± 11.6 | 0.2 |
| Controls | 16.0 ± 3.7 | |
| CD3−CD16dimCD56dimCD244−CD196− | Patients | 7.7 ± 7.2 | < 0.001 |
| Controls | 1.5 ± 1.5 | |
↓ Table 6. Type of Chemotherapy Received and Responses
| Type | Descriptive |
|---|
| Data are expressed as numbers and percentages. Ara C: cytarabine; ATRA: all-trans retinoic acid. |
| Chemotherapy | |
| 3+7 regimen | 16 (61.5%) |
| Low-dose Ara C | 9 (34.6%) |
| ATRA + low-dose Ara C | 1 (3.8%) |
| Response | |
| Remission | 17 (65.4%) |
| No remission | 9 (34.6%) |
↓ Table 7. Differential Expression of Immune Cells According to Risk Groups
| Immune cells | Mean ± SD | P-value |
|---|
| Data are expressed as mean ± SD and analyzed by Robust tests. P ≤ 0.05 is significant. |
| CD3+CD16+CD56+CD244−CD196− NKT | | |
| Low risk | 1.2 ± 0.9 | 0.05 |
| Intermediate risk | 0.42 ± 0.8 | |
| High risk | 0.42 ± 0.5 | |
| CD3− NK | | |
| Low risk | 32.8 ± 3.5 | 0.013 |
| Intermediate risk | 36.5 ± 9.3 | |
| High risk | 64.8 ± 25.0 | |
| CD3−CD16brightCD56dim | | |
| Low risk | 12.4 ± 9.8 | 0.024 |
| Intermediate risk | 10.4 ± 6.2 | |
| High risk | 4.6 ± 2.7 | |
| CD3−CD16brightCD56bright | | |
| Low risk | 31.8 ± 11.4 | 0.019 |
| Intermediate risk | 35.1 ± 13.5 | |
| High risk | 50.2 ± 14.0 | |
| CD3−CD16dimCD56dim | | |
| Low risk | 30.4 ± 14.3 | 0.005 |
| Intermediate risk | 24.0 ± 12.7 | |
| High risk | 10.4 ± 3.7 | |
| CD3−CD16+CD56−CD244+CD196− | | |
| Low risk | 43.9 ± 13.6 | 0.047 |
| Intermediate risk | 33.1 ± 12.3 | |
| High risk | 40.14 ± 18.6 | |
| CD3−CD16−CD56+CD244−CD196− | | |
| Low risk | 9.5 ± 5.5 | 0.046 |
| Intermediate risk | 19.8 ± 11.6 | |
| High risk | 12.5 ± 6.7 | |