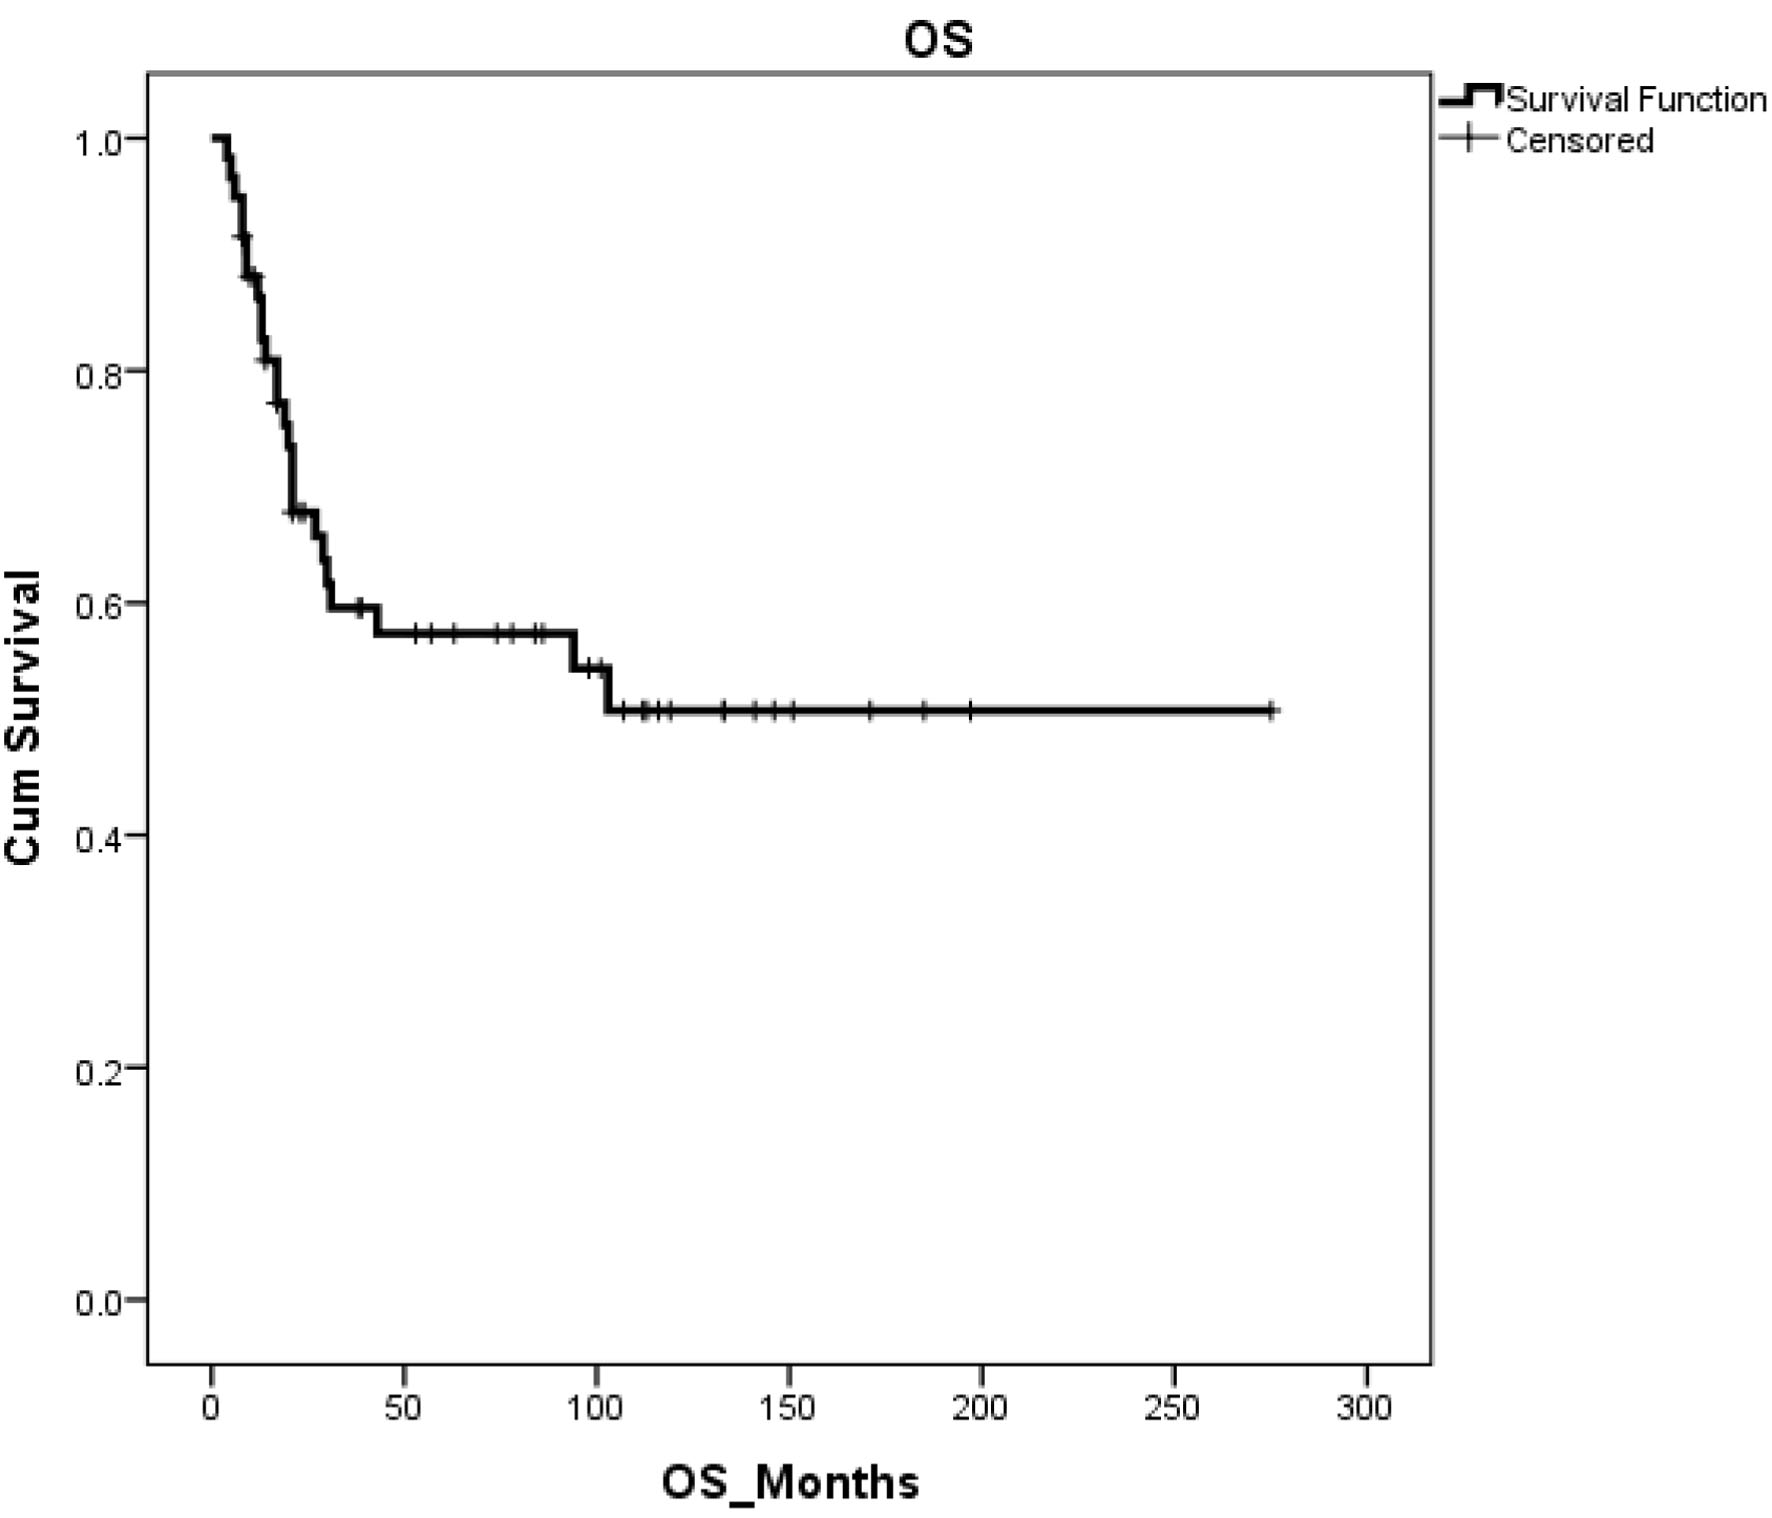
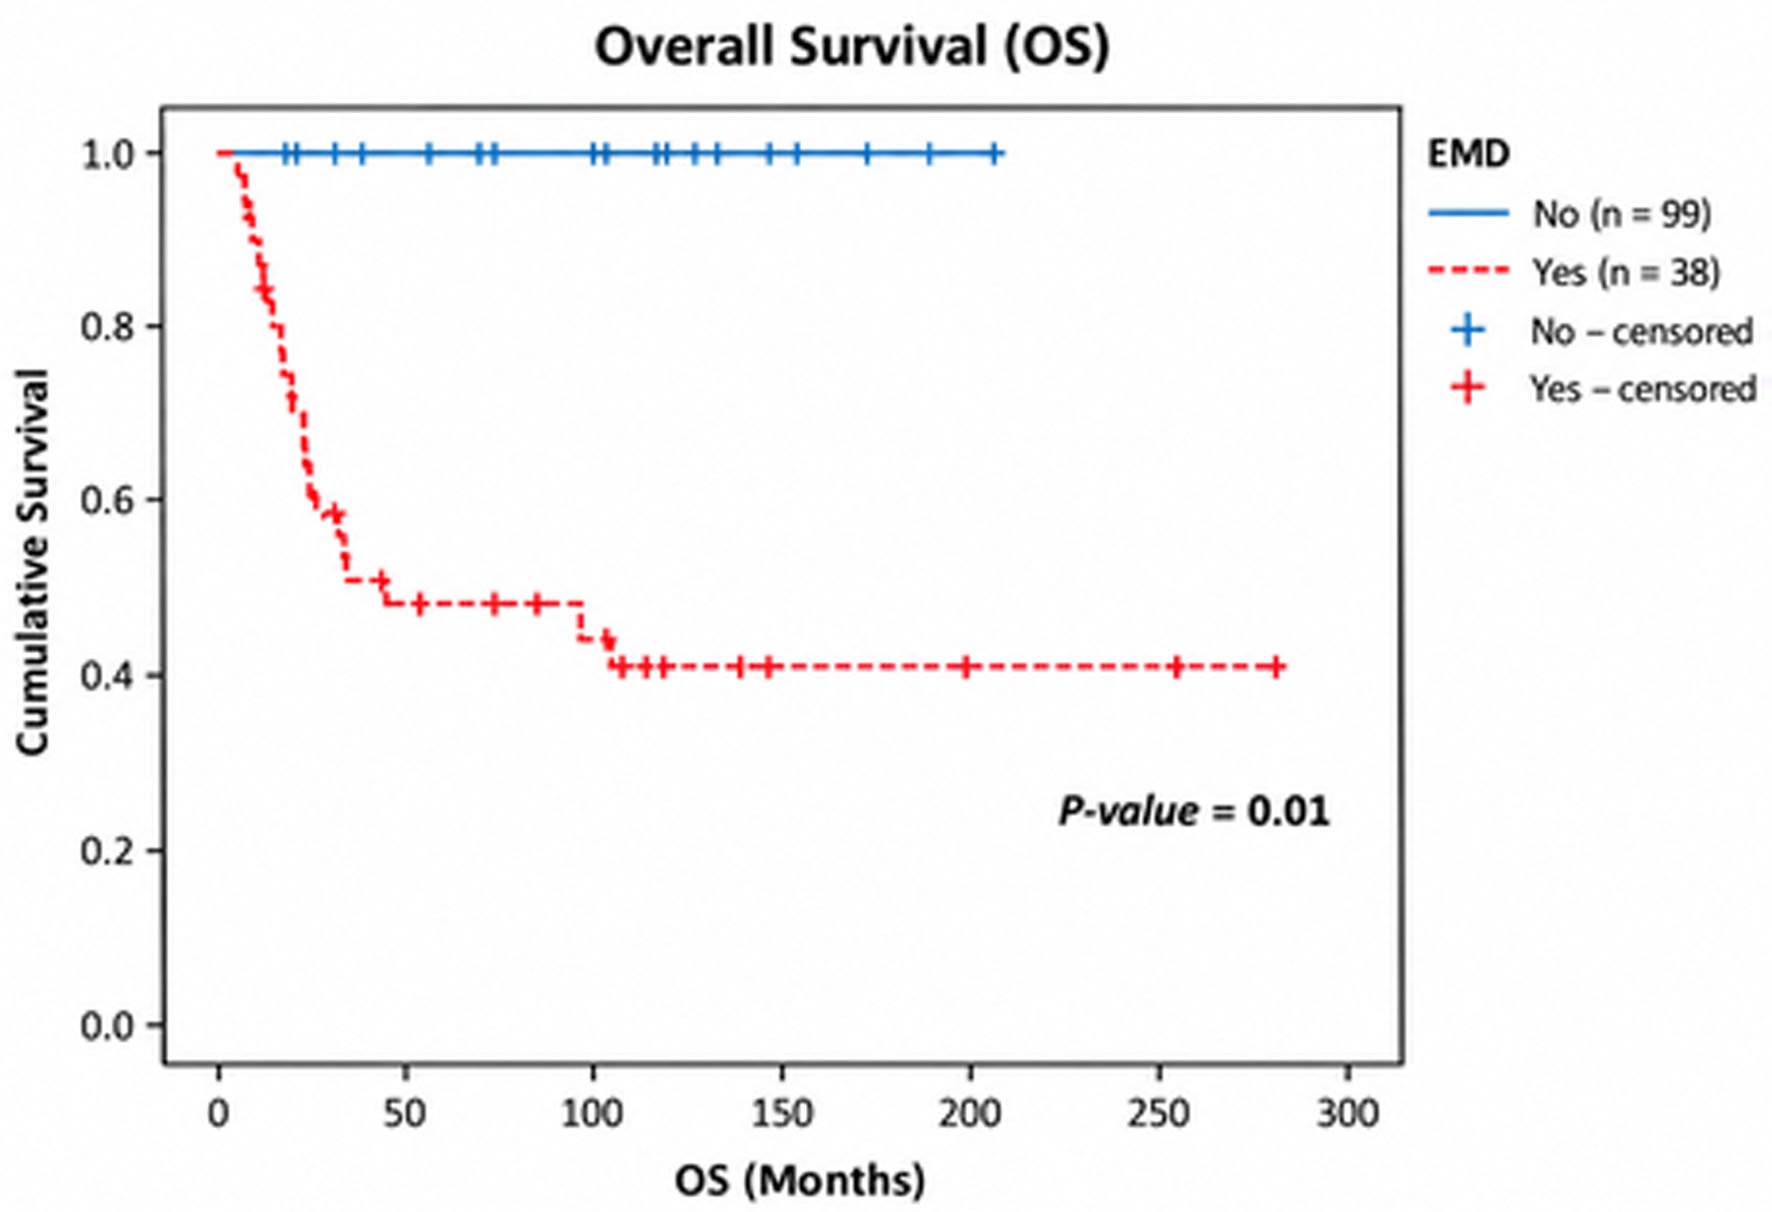
↓ Figure 1. Overall survival for all patients.
| Journal of Hematology, ISSN 1927-1212 print, 1927-1220 online, Open Access |
| Article copyright, the authors; Journal compilation copyright, J Hematol and Elmer Press Inc |
| Journal website https://jh.elmerpub.com |
Original Article
Volume 15, Number 5, October 2026, pages 236-247
Higher Relapse Rate and Resource Utilization With Ara-C Consolidation Chemotherapy Alone Compared to Hematopoietic Cell Transplantation in First Remission in a Cohort of Younger Adults With Acute Myeloid Leukemia With t(8;21) (q22;q22.1)
Figures
Tables
| Category | Variable | Value (percentage/range) |
|---|---|---|
| Demographics | Sex | Female 28 (47.46%) Male 31 (52.54%) |
| Median age, years (range) | 23 (14–57) | |
| Age under 40 years | 50 (84%) | |
| Laboratory and disease characteristics | WBC count, median (range) | 10 (1.06–104) |
| WBC count > 20 | 18/58 (31%) | |
| Platelet count, median (range) | 30 (5–477) | |
| Additional cytogenetic abnormalities | 37/58 (63.7%) | |
| del(9q) | 6/58 (10%) | |
| Loss of sex chromosome | 18/57 (14%) | |
| Extramedullary disease | 11/58 (19%) | |
| Molecular and immunophenotypic features | KIT mutation positive | 3/21 (14%) |
| CD36 positive | 26/40 (65%) | |
| FLT3 mutation | 1/14 (7%) | |
| CD19 positive | 36/45 (80%) | |
| Induction treatment | ICE | 39 (66%) |
| 3+7 | 16 (27%) | |
| FA/FLAG-IDA | 2 (3%) | |
| ARAC | 1 (2%) | |
| Other | 2 (3%) |
| Characteristic | AutoHCT (n = 15) | AlloHCT (n = 20) | Chemotherapy (n = 14) | P-value* |
|---|---|---|---|---|
| *P-values from Kruskal–Wallis test (age) or chi-square test (categorical variables) across the three post-remission therapy arms. alloHCT: allogeneic HCT; autoHCT: autologous transplant; WBC: white blood cell count. | ||||
| Age, median (range), years | 31 (16–57) | 20.5 (14–45) | 24 (14–56) | 0.029 |
| WBC > 20 × 109/L | 4/15 (27%) | 5/19 (26%) | 5/14 (36%) | 0.81 |
| Extramedullary disease | 4/15 (27%) | 3/20 (15%) | 4/14 (29%) | 0.58 |
| CD56 positive | 10/12 (83%) | 7/11 (64%) | 6/12 (50%) | 0.22 |
| Additional cytogenetic abnormality | 9/14 (64%) | 14/20 (70%) | 6/14 (43%) | 0.26 |
| Del(9q) | 3/14 (21%) | 2/20 (10%) | 0/14 (0%) | 0.18 |
| Male sex | 6/15 (40%) | 12/20 (60%) | 6/14 (43%) | 0.44 |
| PRT arm | CIR | NRM | ||||||||
|---|---|---|---|---|---|---|---|---|---|---|
| Probability | Standard error | 95% LLC | 95% ULC | P-value | Probability | Standard error | 95% LLC | 95% ULC | P-value | |
| CIR: cumulative incidence of relapse; LLC: lower limit of confidence; PRT: post-remission therapy; ULC: upper limit of confidence. | ||||||||||
| HCT | 0.28 | 21.875 | 148.00 | 233.75 | 0.044 | 0.12 | 0.058 | 0.0071 | 0.232 | 0.16 |
| CHEMO | 0.64 | 15.24 | 17.92 | 77.69 | 0 | 0 | 0 | 0 | ||
| AutoHCT | 0.33 | 34.361 | 111.74 | 246.442 | 0 | 0 | 0 | 0 | ||
| AlloHCT | 0.15 | 19.130 | 105.29 | 180.28 | 0.109 | 0.2 | 0.09 | 0.0236 | 0.376 | 0.19 |
| CHEMO | 0.64 | 15.249 | 17.92 | 77.695 | 0 | 0 | 0 | 0 | ||