Journal of Hematology, ISSN 1927-1212 print, 1927-1220 online, Open Access
Article copyright, the authors; Journal compilation copyright, J Hematol and Elmer Press Inc
Journal website https://jh.elmerpub.com

Original Article

Volume 15, Number 3, June 2026, pages 135-143


Two Decades of Light-Chain Amyloidosis: Real-World Trends in Diagnosis, Treatment, and Survival

Figures

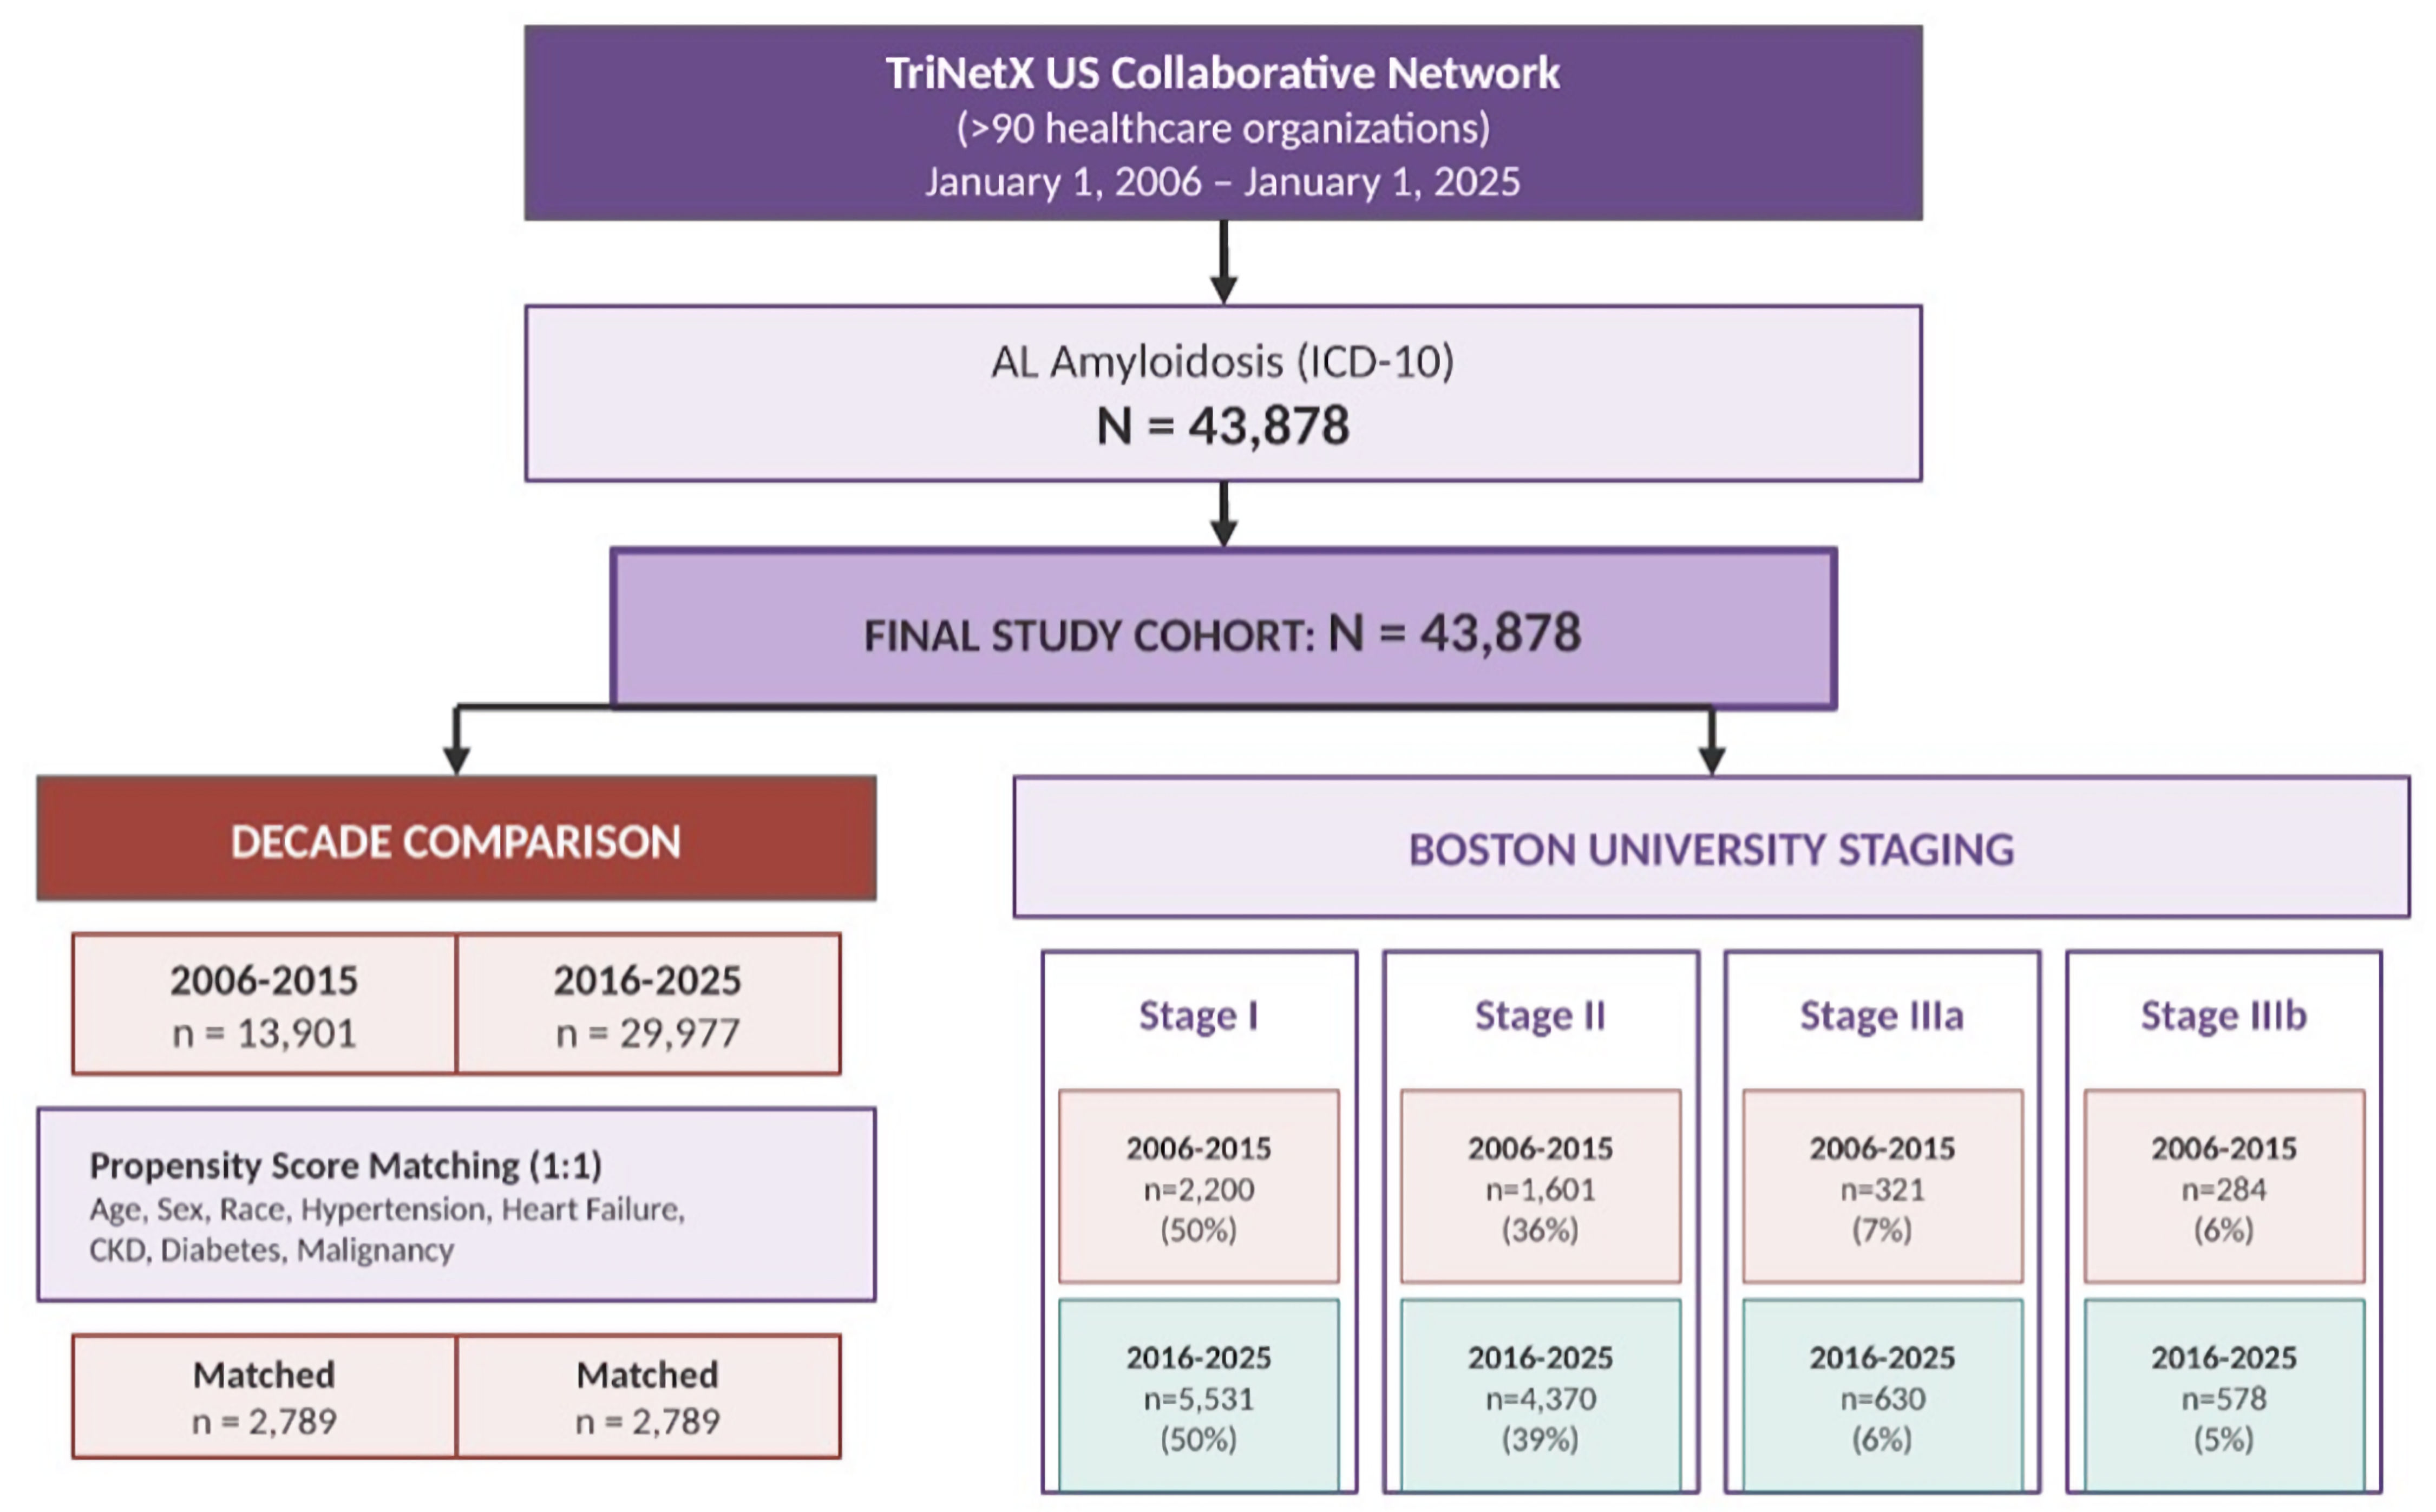
↓  Figure 1. Flow diagram of patient selection, analysis cohorts, and staging distribution. Patients with systemic amyloidosis were identified from the TriNetX US Collaborative Network using International Classification of Diseases, 10th Revision (ICD-10) code E85 between January 1, 2006, and December 31, 2025. Propensity score matching (1:1) was performed using age, sex, race, and comorbidities, yielding 2,789 matched patients per group.
Figure 1.
↓  Figure 2. Kaplan–Meier overall survival (OS) analyses based on decade (2006–2015 vs. 2016–2025) and disease state after propensity score matching. (a) All stages. (b) Stage I. (c) Stage II. (d) Stage IIIb. HR: hazard ratio; CI: confidence interval.
Figure 2.
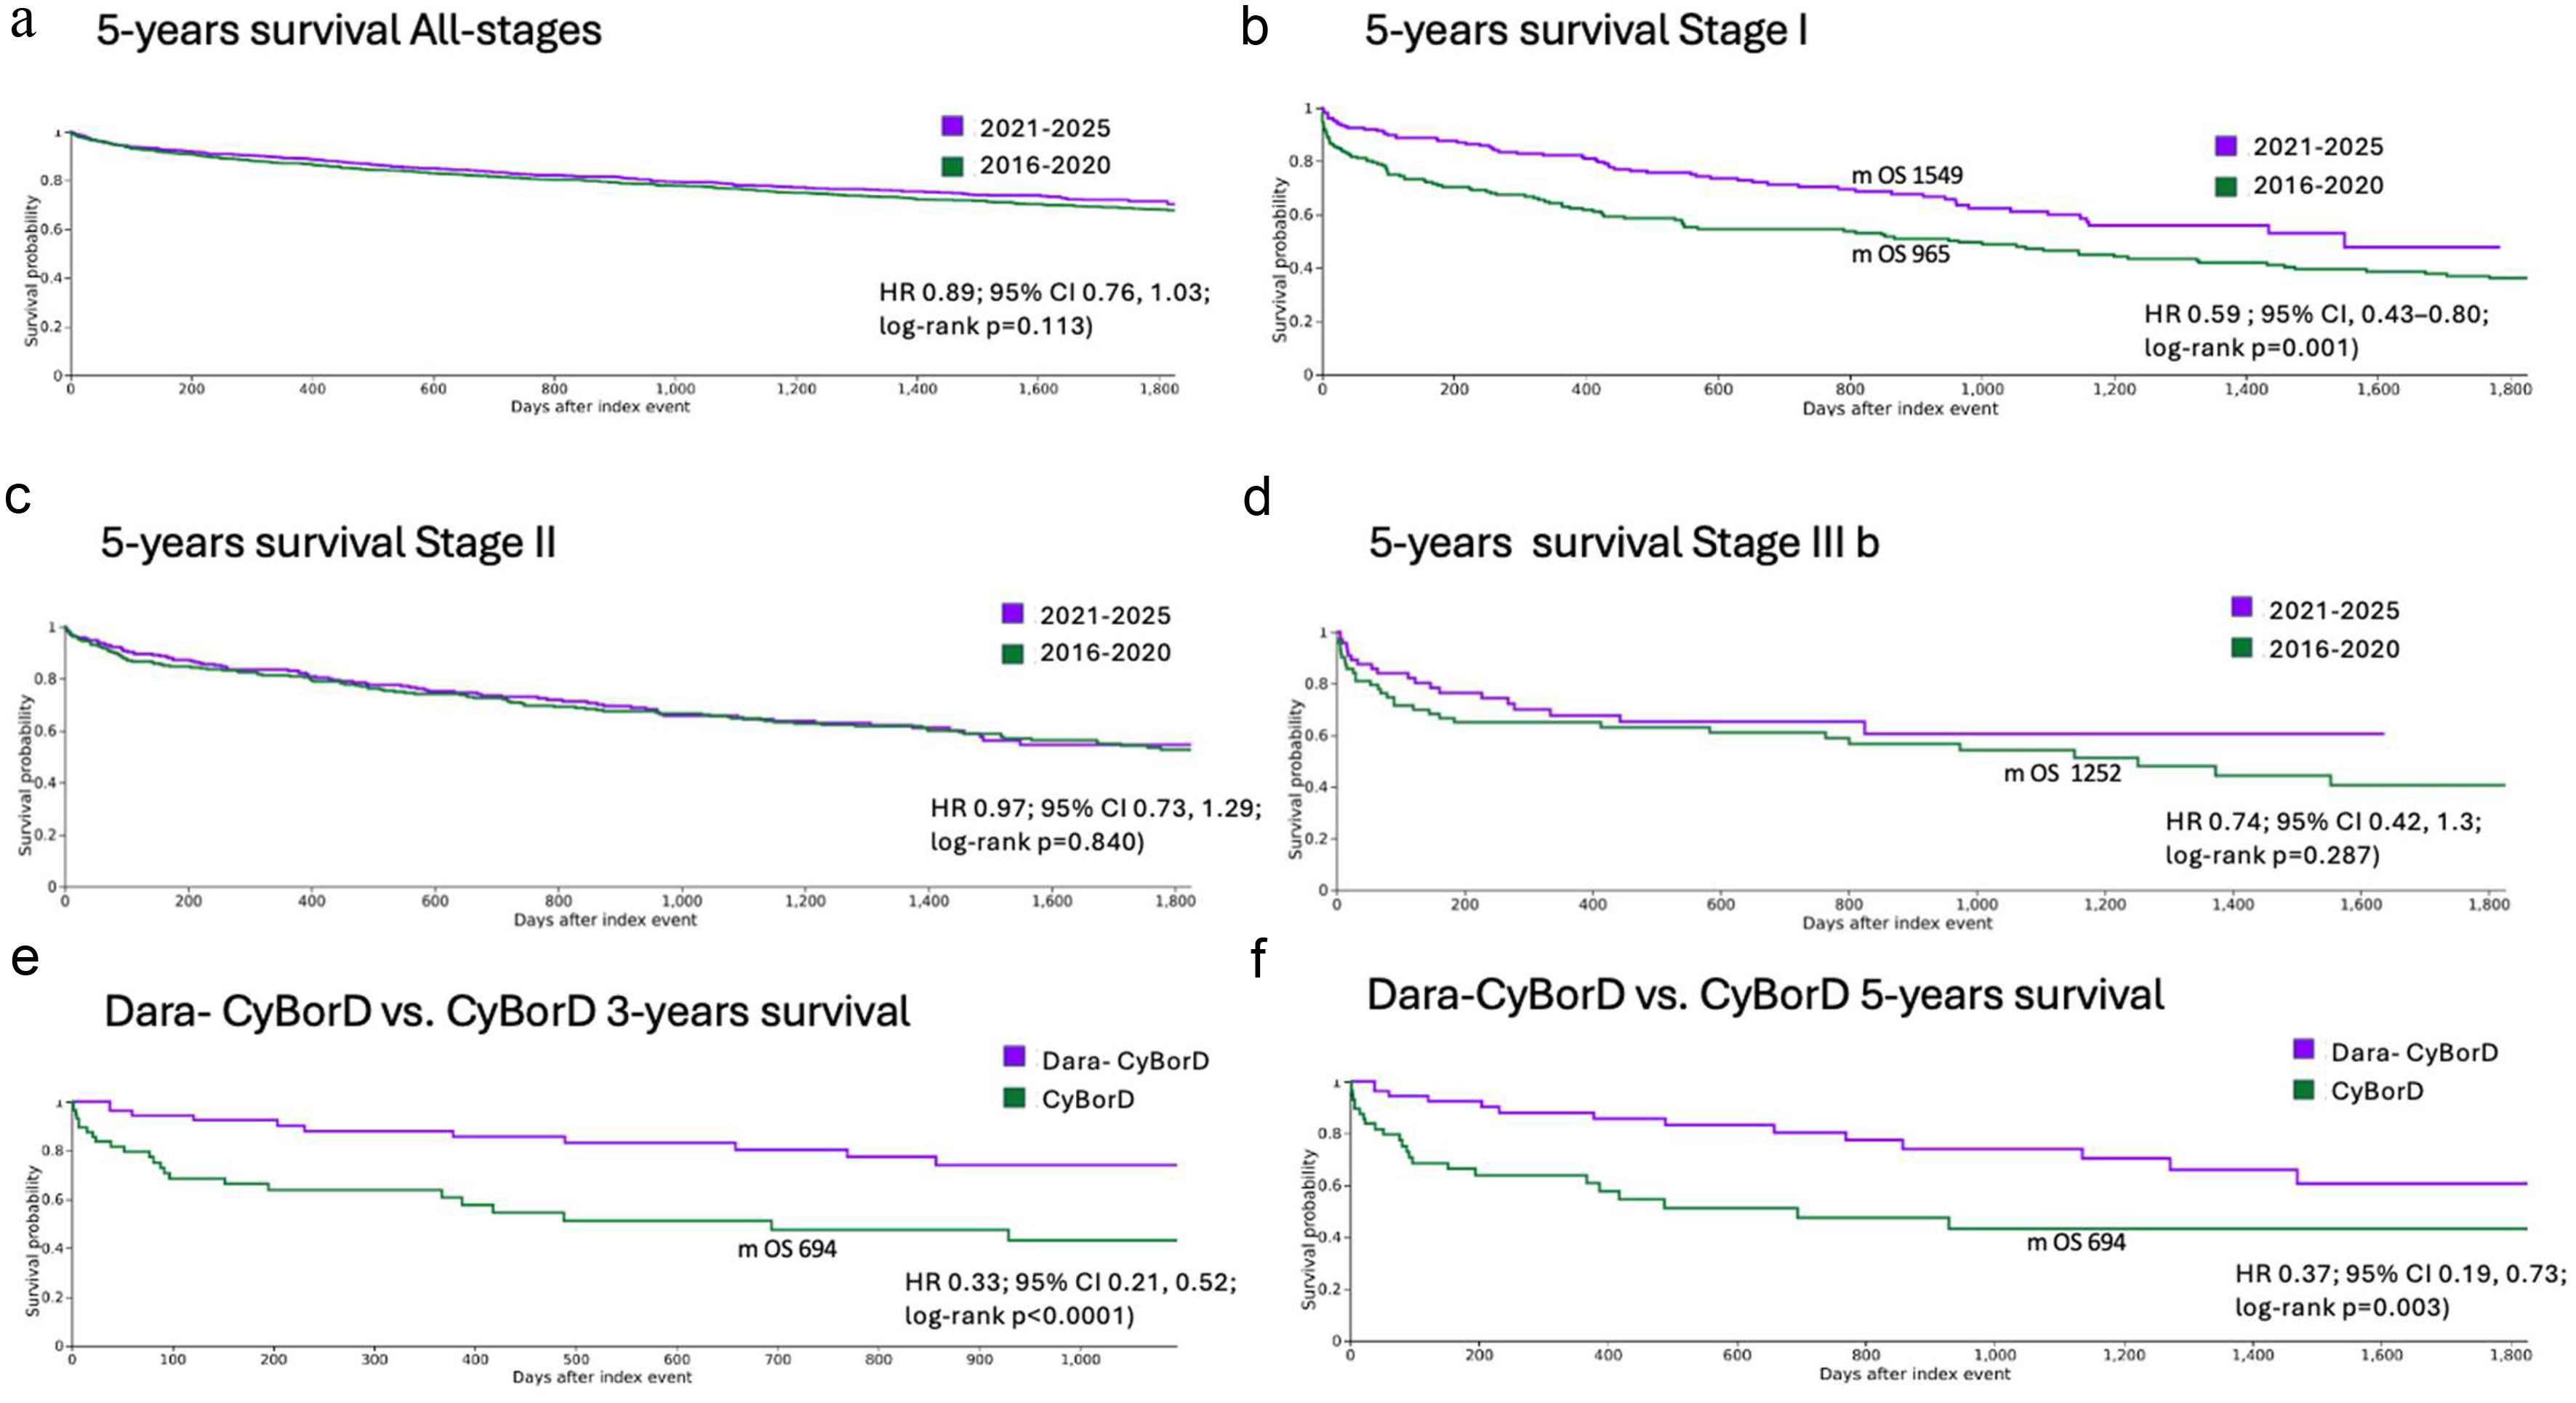
↓  Figure 3. Kaplan–Meier analysis curves comparing overall survival (OS) before (2016–2020) and after (2021–2025) the introduction of daratumumab-based therapy. (a) All stages. (b) Stage I. (c) Stage II. (d) Stage IIIb. (e, f) Treatment comparison. Patients receiving Dara-CyBorD demonstrated improved 3-year, and 5-year OS compared with CyBorD alone. HR: hazard ratio; CI: confidence interval.
Figure 3.
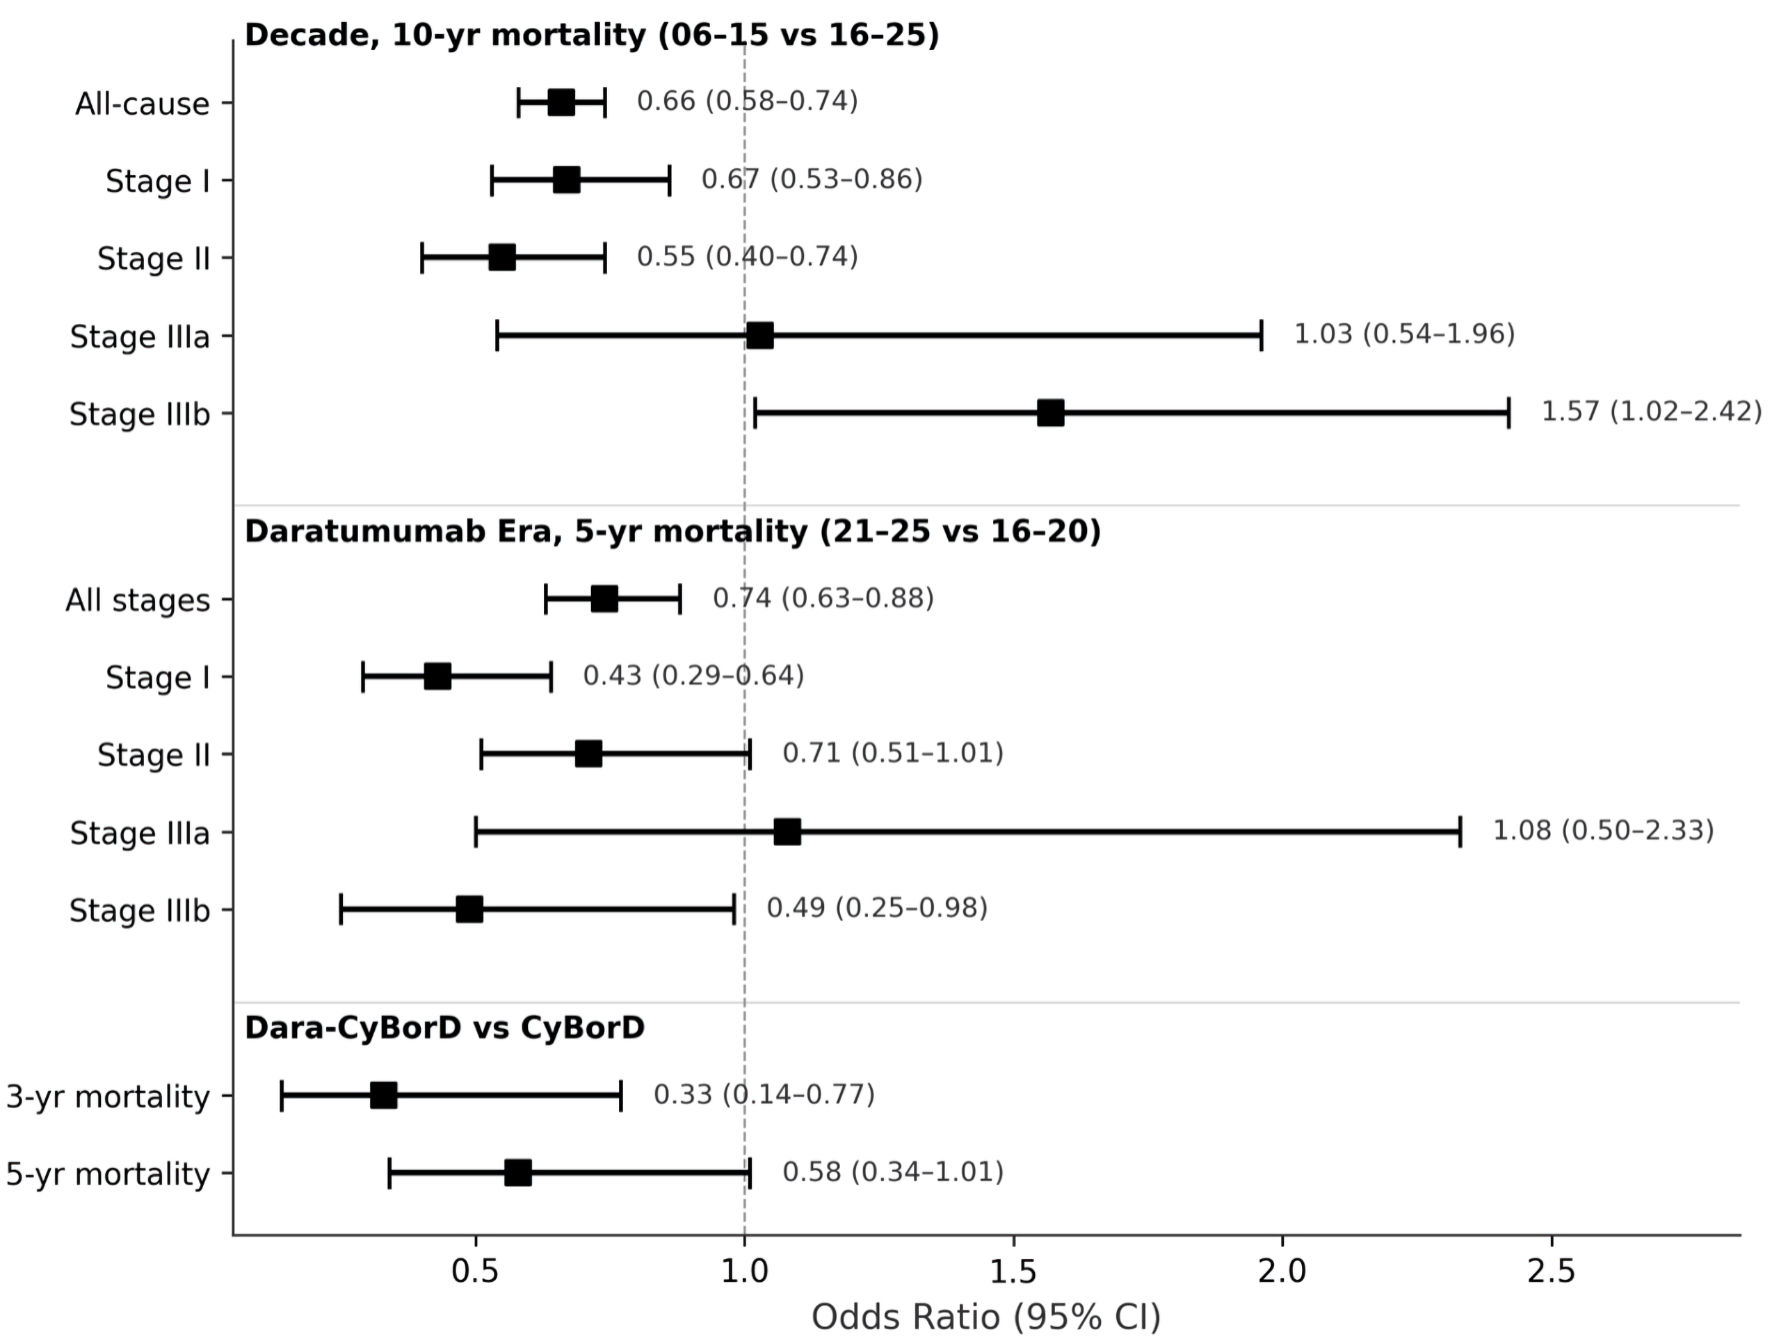
↓  Figure 4. Forest plot of mortality outcomes by era and disease stage. Odds ratios (OR) with 95% CIs for mortality comparing patients diagnosed in 2006–2015 vs. 2016–2025 (10-year mortality) and patients treated in the pre-daratumumab (2016–2020) vs. daratumumab (2021–2025) eras (5-year mortality), stratified by Boston University cardiac stage. Additional analyses compare outcomes with Dara-CyBorD vs. CyBorD for 3-year and 5-year mortality. The dashed vertical line indicates OR = 1.0 (no difference). Values < 1 favor the modern or daratumumab era cohort. CI: confidence interval; yr: year.
Figure 4.

Table

↓  Table 1. Baseline Characteristics of Patients Diagnosed With Systemic AL Amyloidosis in 2006–2015 and 2016–2025 Before and After Propensity Score Matchinga
 
2016–2025 cohort (n = 27,198)2006–2015 cohort (n = 12,659)P valueSMD
aPropensity score matching (1:1) was performed using age, sex, race, and major comorbidities (diabetes mellitus, hypertension, chronic kidney disease, heart failure, ischemic heart disease, and malignancy). Covariate balance was assessed using SMD, with values < 0.1 indicating adequate balance. Cardiac stage distribution is according to the Boston University staging system. SD: standard deviation; IQR: interquartile range; SMD: standardized mean differences.
Age at index (years), mean ± SD61.1 ± 20.756.6 ± 23.50.0010.202
Current age (years), mean ± SD65.4 ± 20.069.3 ± 22.60.0010.183
Age at index (years), median (IQR)66 (24)63 (28)
Race, n (%)
  White14,320 (52.7)7,259 (58.0)0.0010.108
  Black or African American3,753 (13.8)1,258 (10.0)0.0010.116
  Asian989 (3.6)1,107 (8.8)0.0010.217
  American Indian or Alaska Native91 (0.3)36 (0.3)0.4410.008
  Native Hawaiian or Other Pacific Islander85 (0.3)26 (0.2)0.0660.021
  Other797 (2.9)392 (3.1)0.2750.012
  Unknown7,163 (26.3)2,440 (19.5)0.0010.163
Ethnicity, n (%)
  Not Hispanic or Latino17,301 (63.6)8,224 (65.7)0.0010.044
  Unknown8,776 (32.3)3,609 (28.8)0.0010.075
Comorbidities, n (%)
  Heart failure3,744 (13.8)1,276 (10.2)0.0010.11
  Chronic kidney disease3,445 (12.7)1,166 (9.3)0.0010.107
  Hypertensive diseases6,284 (23.1)3,116 (24.9)0.0010.042
  Diabetes mellitus3,362 (12.4)1,057 (8.4)0.0010.129
  Neoplasms3,152 (11.6)1,285 (10.3)0.0010.042
  Atherosclerotic heart disease1,756 (6.5)785 (6.3)0.4830.008