Figures
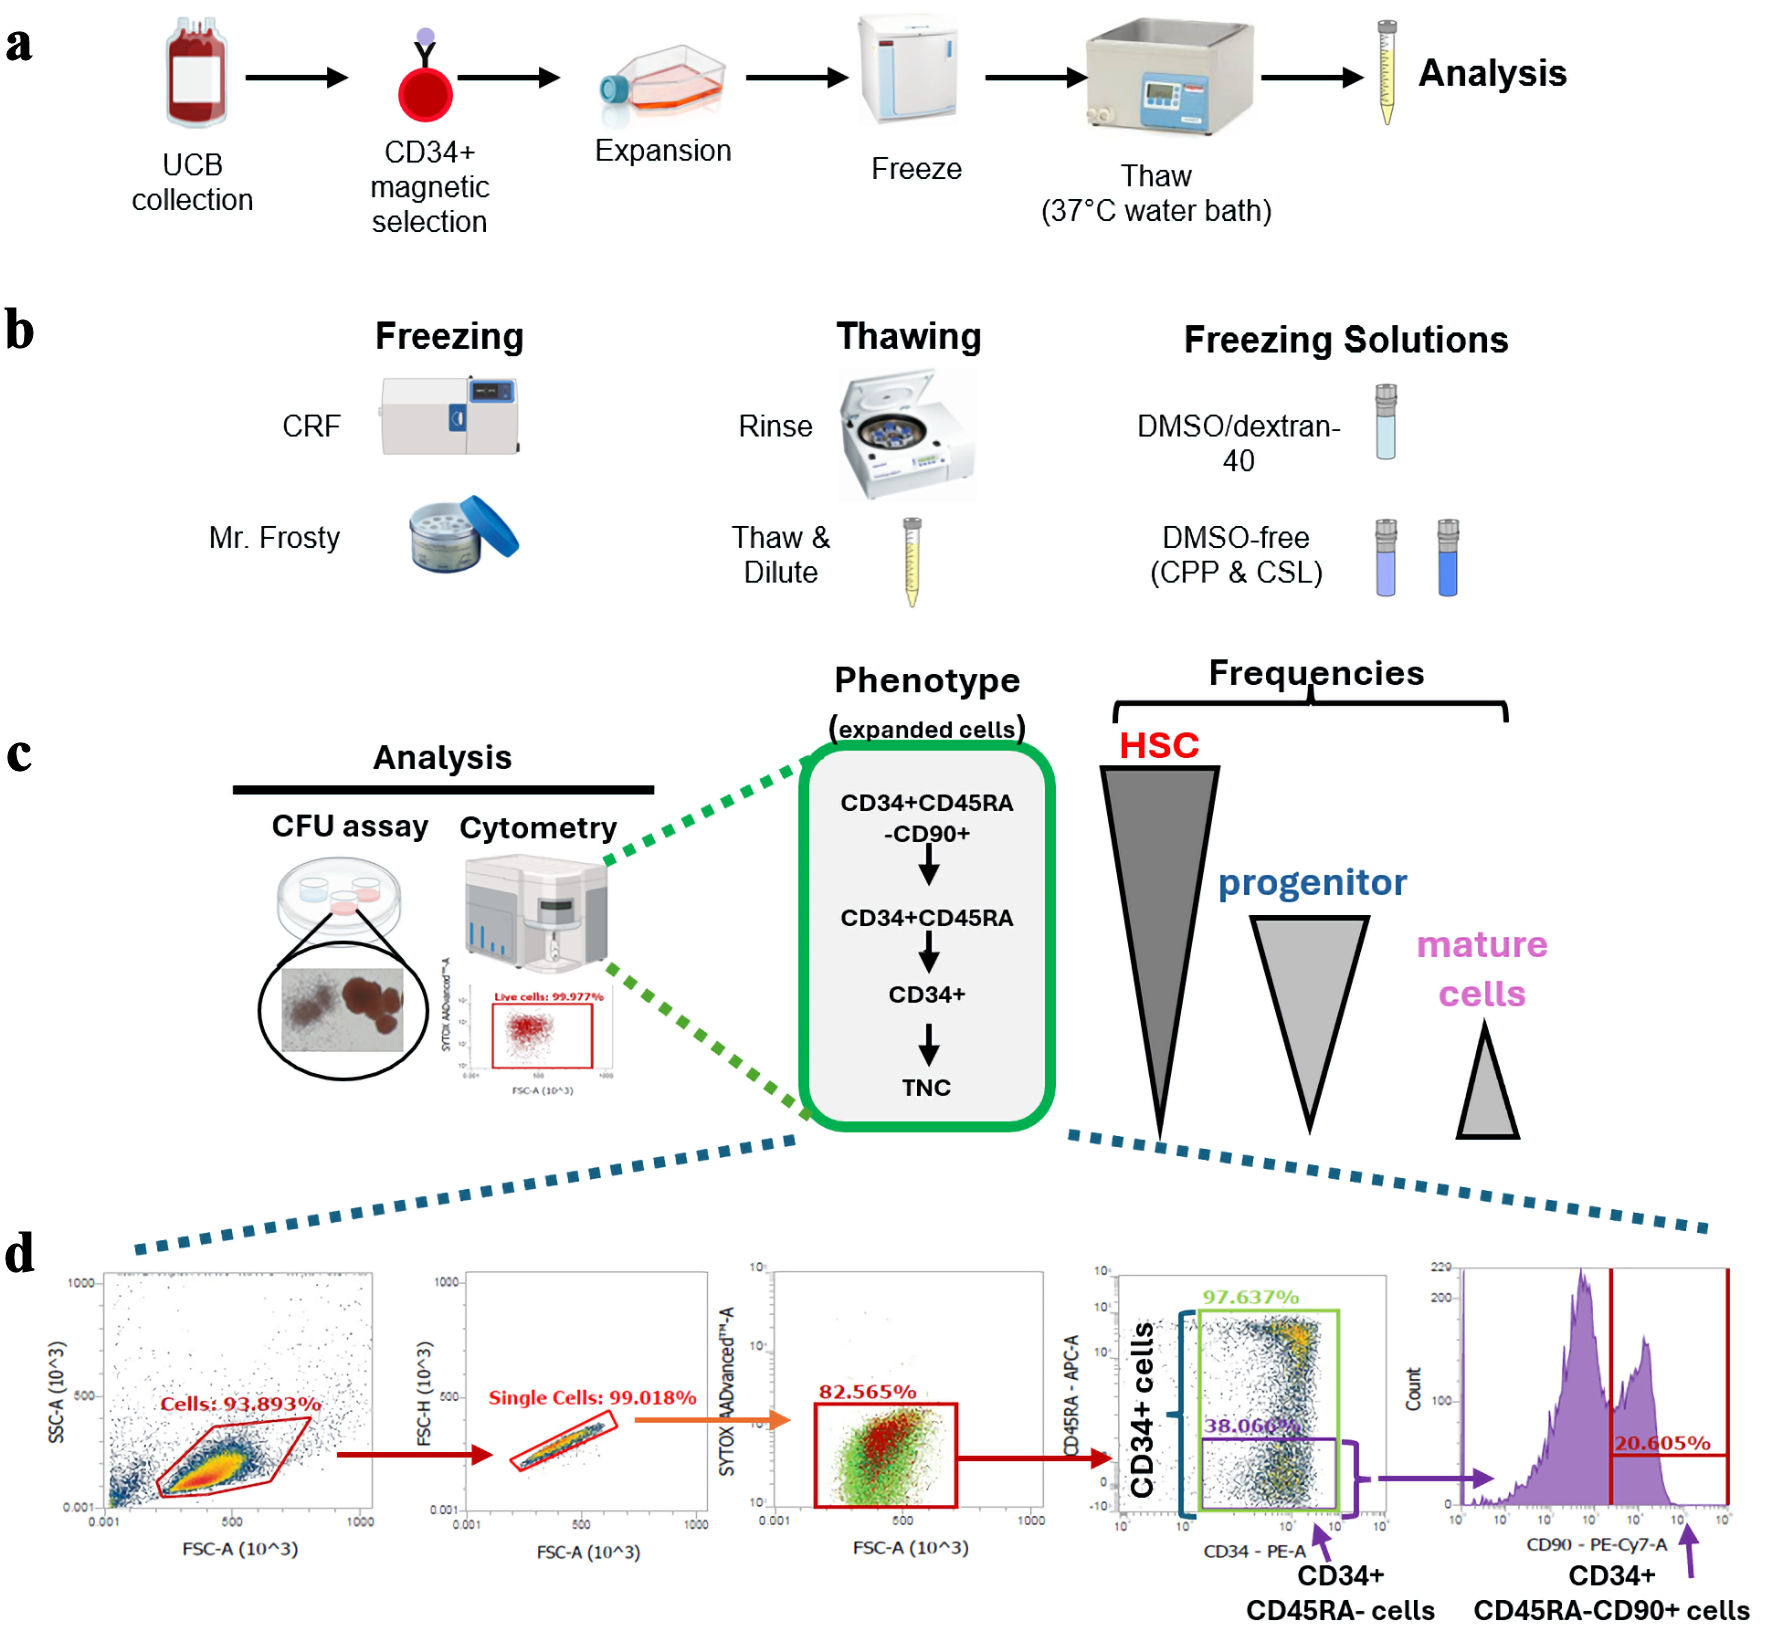
↓ Figure 1. Overview
of the experimental design
and HSPC-fractions investigated. (a) Overview of experimental design. (b) Cryovariables investigated in
this work. (c) Summary of analyses done on samples post-thaw. HSPC-fractions tracked herein by flow
cytometry and their relative content in HSC, progenitors and mature cells, are presented. (d)
Representative flow cytometry analyses of ex vivo expanded CD34+ cells post-expansion
before freezing. Gating strategy used to track viable cells and frequency of
CD34+-subfractions are presented. HSPC: hematopoietic stem and progenitor cell; UCB:
umbilical cord blood; CRF: controlled-rate freezer; CPP: CryoProtectPure-STEM; CSL: CryoScarLess; CFU:
colony-forming unit; TNC: total nucleated cell; HSC: hematopoietic stem cell; DMSO: dimethyl
sulfoxide.
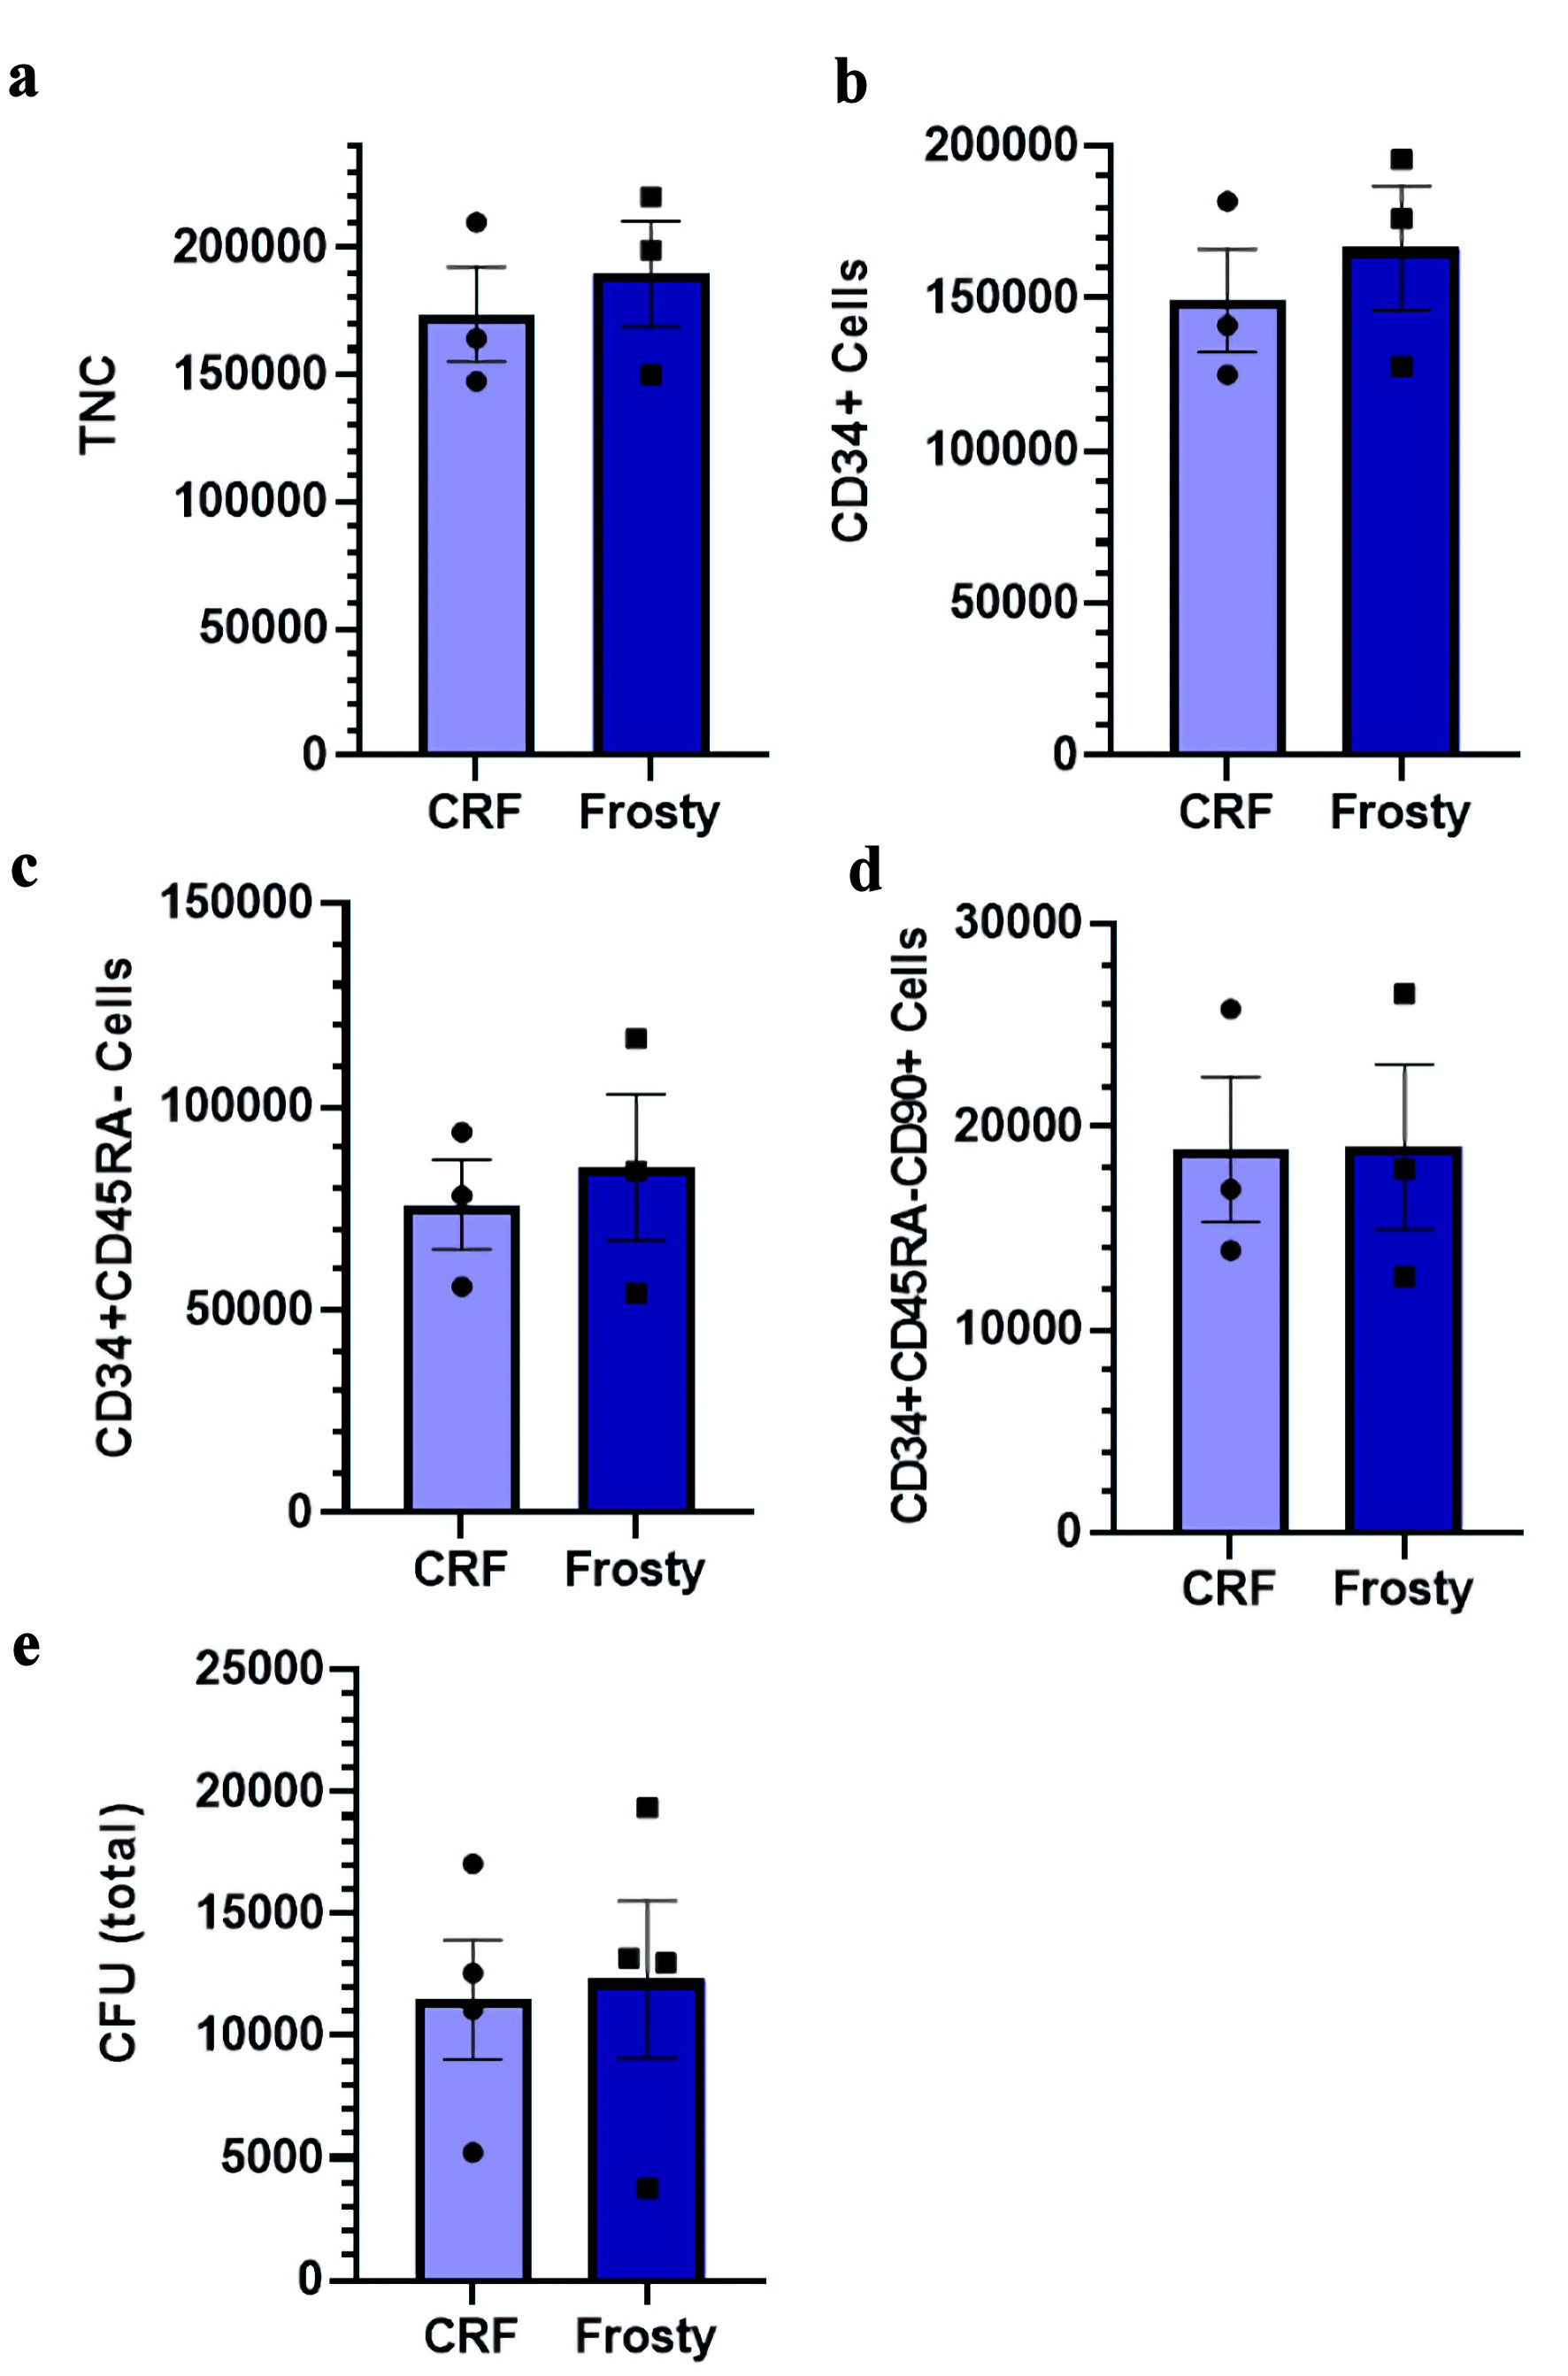
↓ Figure 2. Impact of
different freezing
procedures on the viability and recovery of ex vivo expanded cryopreserved HSPCs. (a–d)
Total number of nucleated cells, CD34+ cells, CD34+CD45RA–
cells, and CD34+CD45RA–CD90+ cells post-thaw in indicated
conditions. (e) Total number of CFU post-thaw. Data are presented as mean ± standard error of the
mean (SEM, n = 3–4). No significant differences are detected. HSPC: hematopoietic stem and
progenitor cell; CRF: controlled-rate freezer; CFU: colony-forming unit; TNC: total nucleated cell.
↓ Figure 3. Impact of
different thawing methods
on the viability and recovery of ex vivo expanded cryopreserved HSPCs. (a–d) Viability of
TNC, CD34+ cells, CD34+CD45RA– cells, and
CD34+CD45RA–CD90+ cells post-thaw. (e–h) Total number of
indicated viable cells post-thaw. (i) Total number of CFU post-thaw. Data are presented as mean ±
standard error of the mean (SEM, n = 4). No significant differences are detected. HSPC: hematopoietic
stem and progenitor cell; CFU: colony-forming unit; TNC: total nucleated cell.

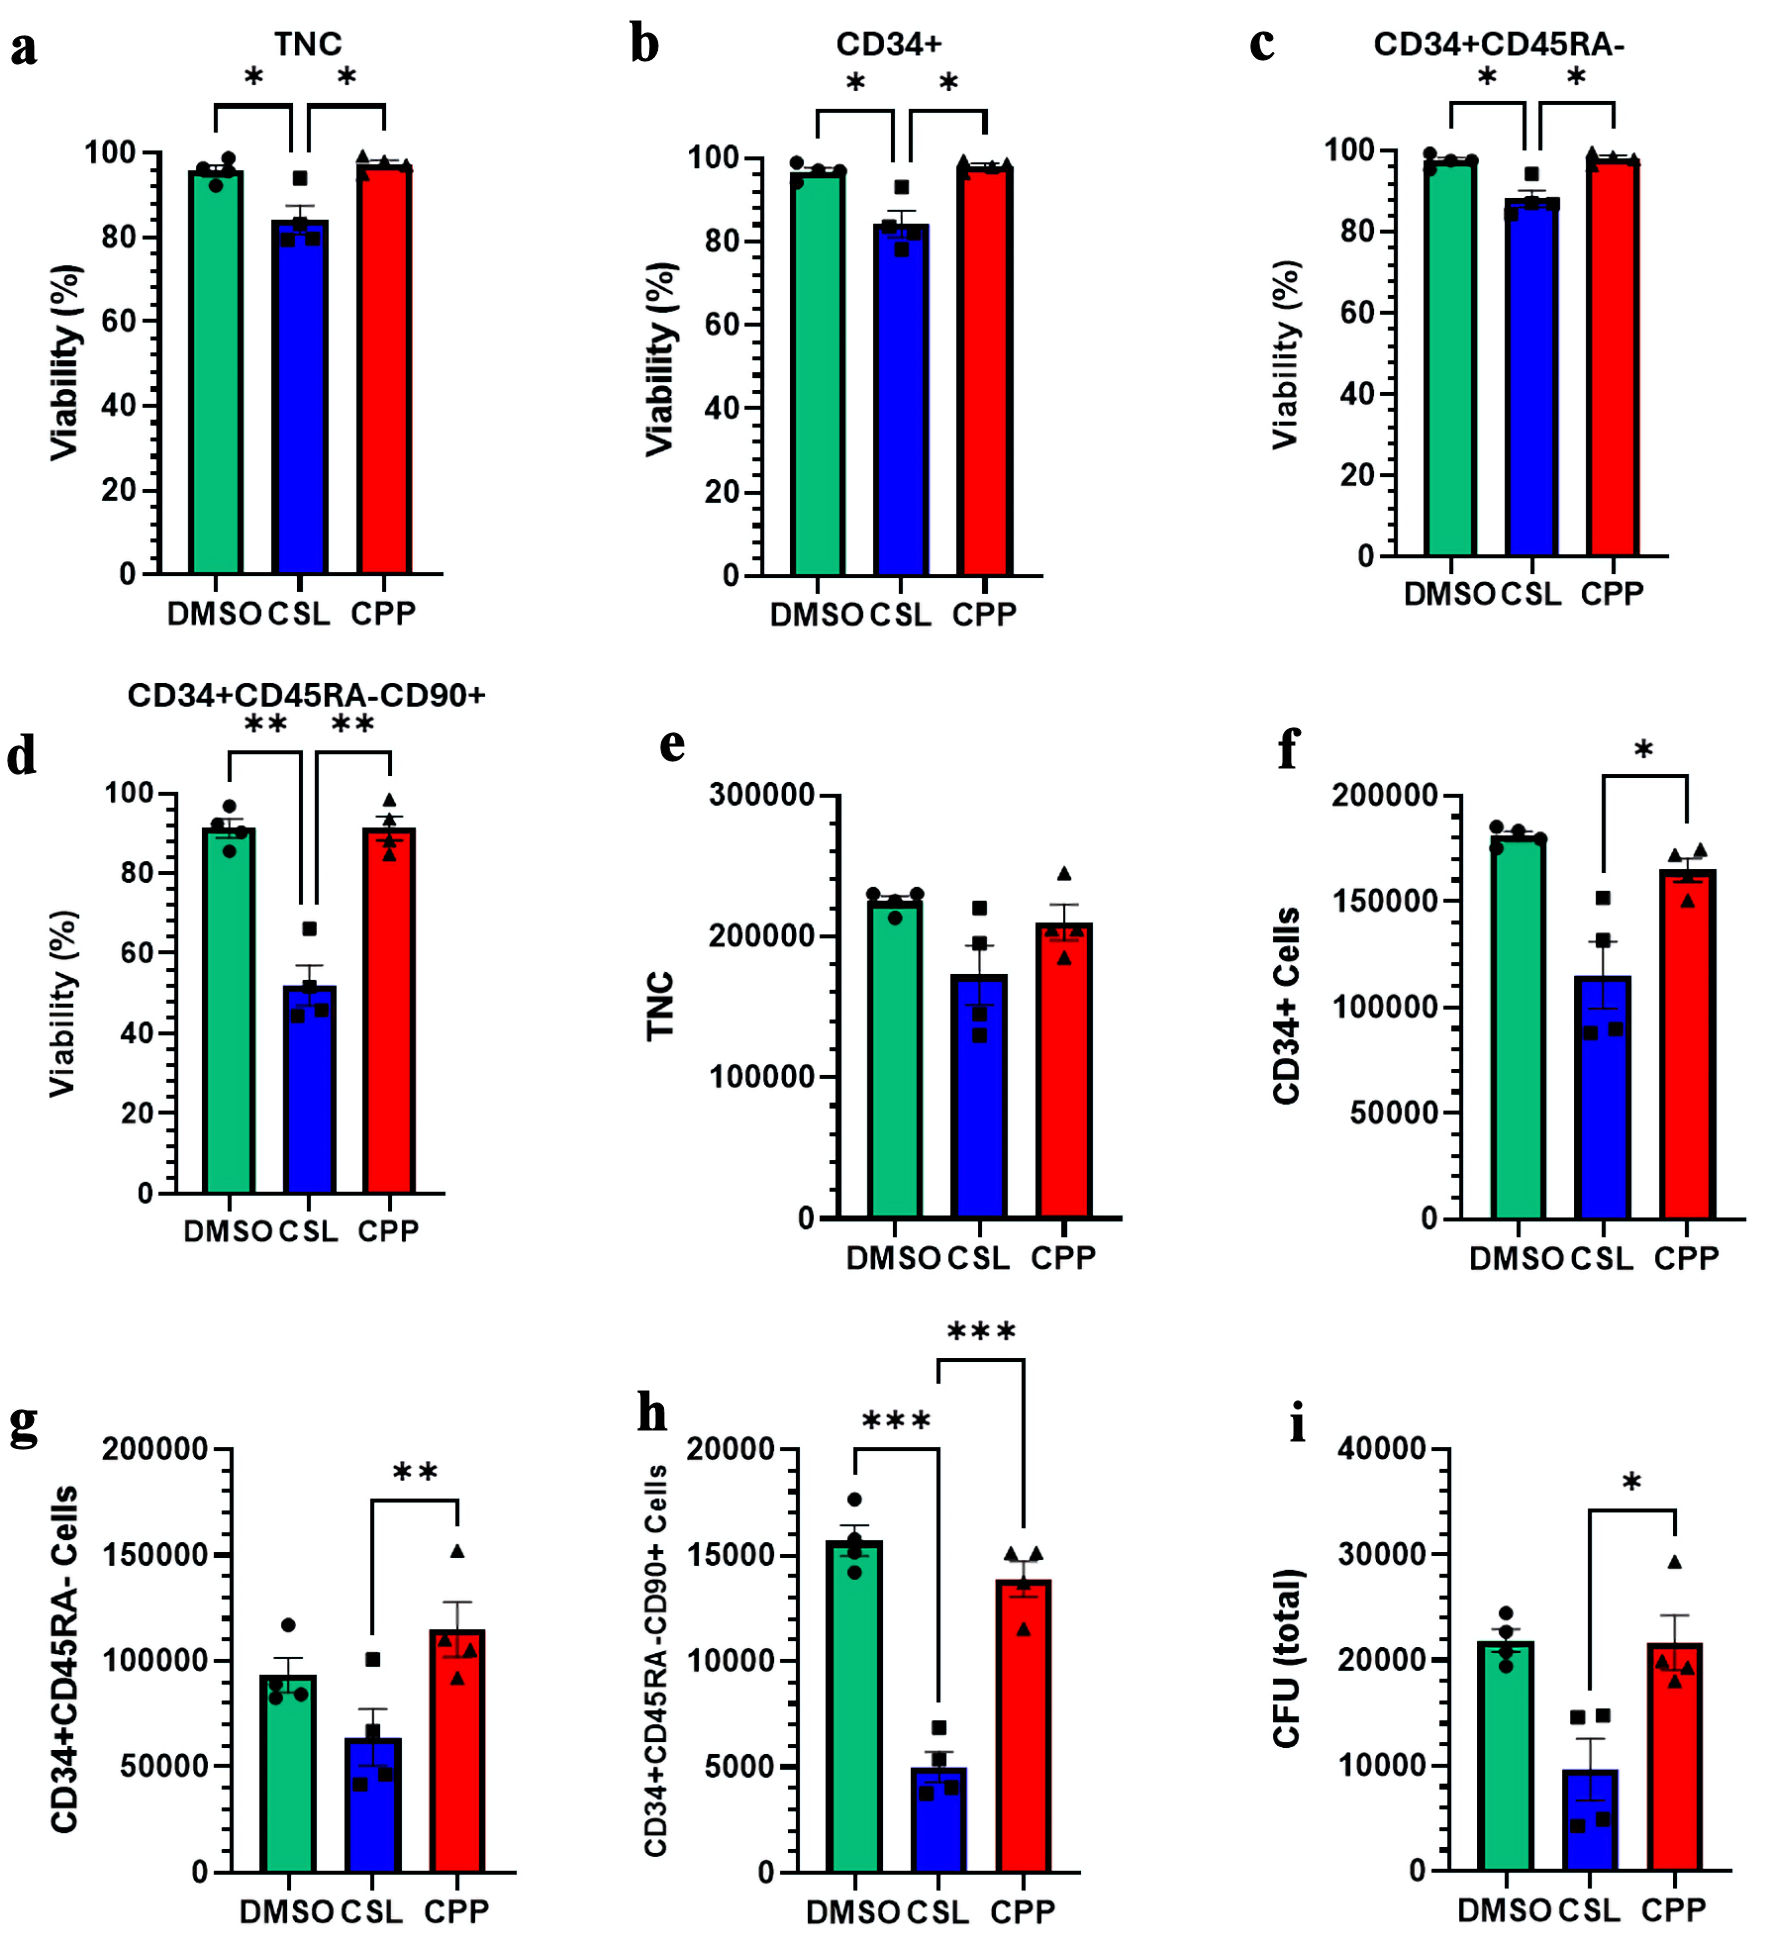
↓ Figure 4. Impact of
different freezing
solutions on the viability and recovery of ex vivo expanded cryopreserved HSPCs. (a–d)
Viability of TNC, CD34+ cells, CD34+CD45RA– cells, and
CD34+CD45RA–CD90+ cells post-thaw. (e–h) Total number of
indicated viable cells post-thaw. (i) Total number of CFU post-thaw. Data are presented as mean ±
standard error of the mean (SEM, n = 3–4). Significant differences were determined by one-way
ANOVA; *P < 0.05, **P < 0.01 and *** P < 0.001. HSPC: hematopoietic stem and progenitor cell;
CPP: CryoProtectPure-STEM; CSL: CryoScarLess; CFU: colony-forming unit; TNC: total nucleated cell; DMSO:
dimethyl sulfoxide; ANOVA: analysis of variance.
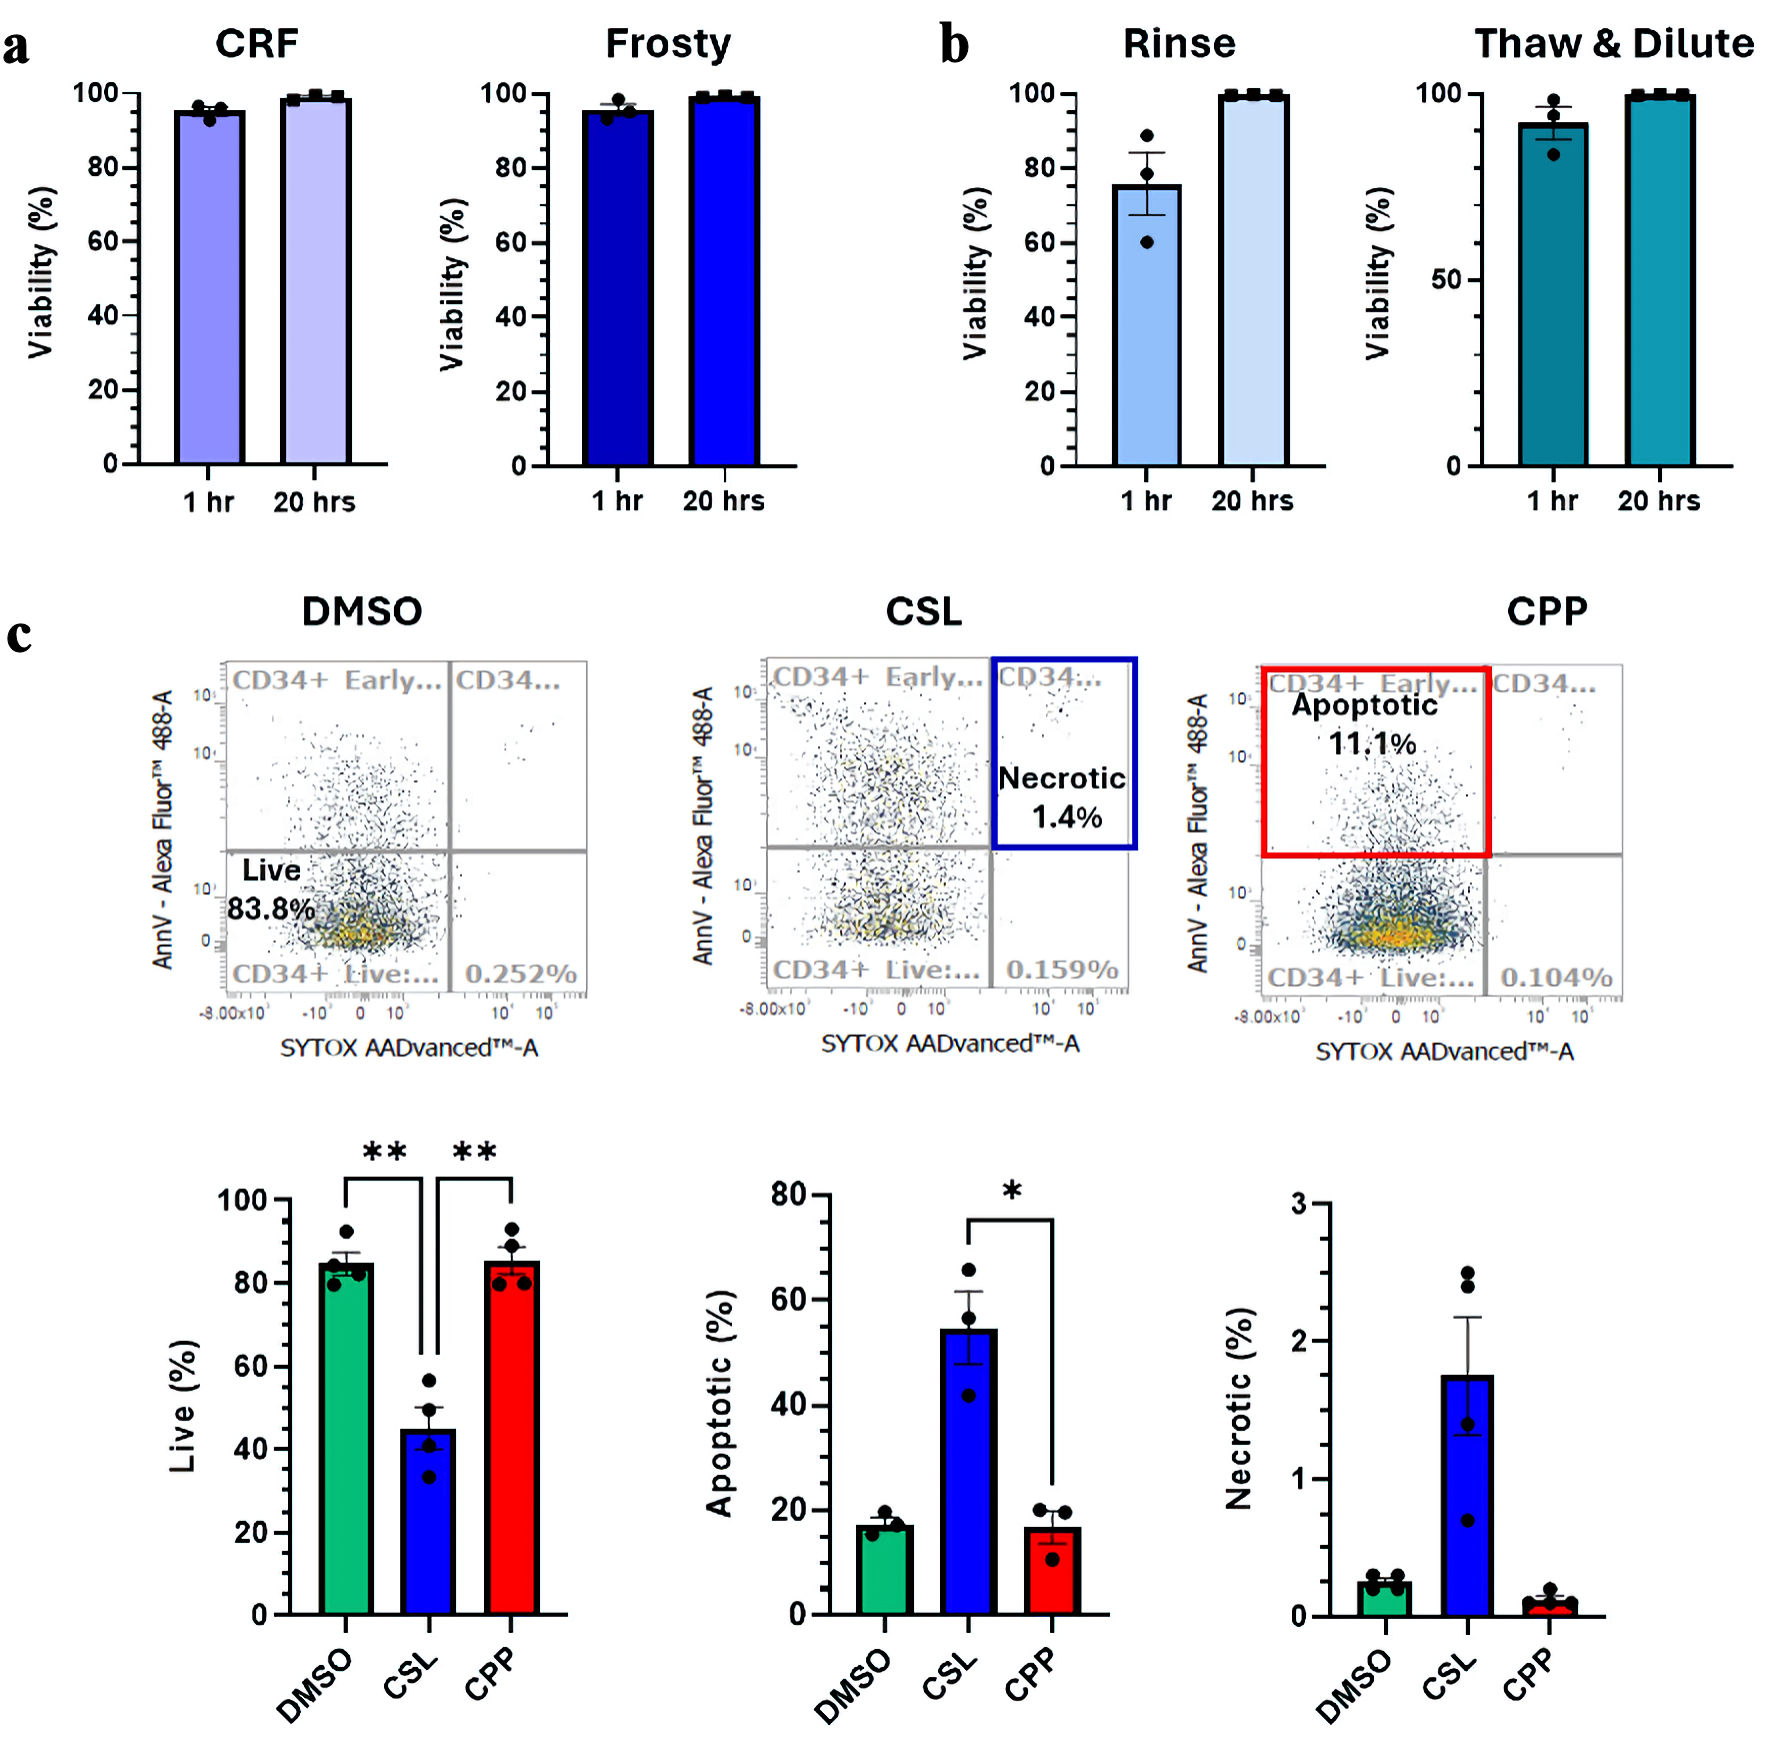
↓ Figure 5.
Investigation of delayed-onset cell
death. (a, b) Viability measured by flow cytometry by Sytox exclusion 1.5 h and 20 h post-thaw.
Comparisons between the different freezing procedures (a) and different thawing procedures (b) are
presented. (c) Impact of different cryosolutions on the incidence of necrosis and apoptosis 20 h
post-thaw. Representative cytometry analyses for each cryosolutions tested and summarized proportions of
live, apoptotic and necrotic cells are presented. Data are presented as mean ± standard error of
the mean (SEM, n = 4). Significant differences were determined by one-way ANOVA; *P < 0.05, **P <
0.01 and ***P < 0.001. CRF: controlled-rate freezer; CPP: CryoProtectPure-STEM; CSL: CryoScarLess;
DMSO: dimethyl sulfoxide; ANOVA: analysis of variance.