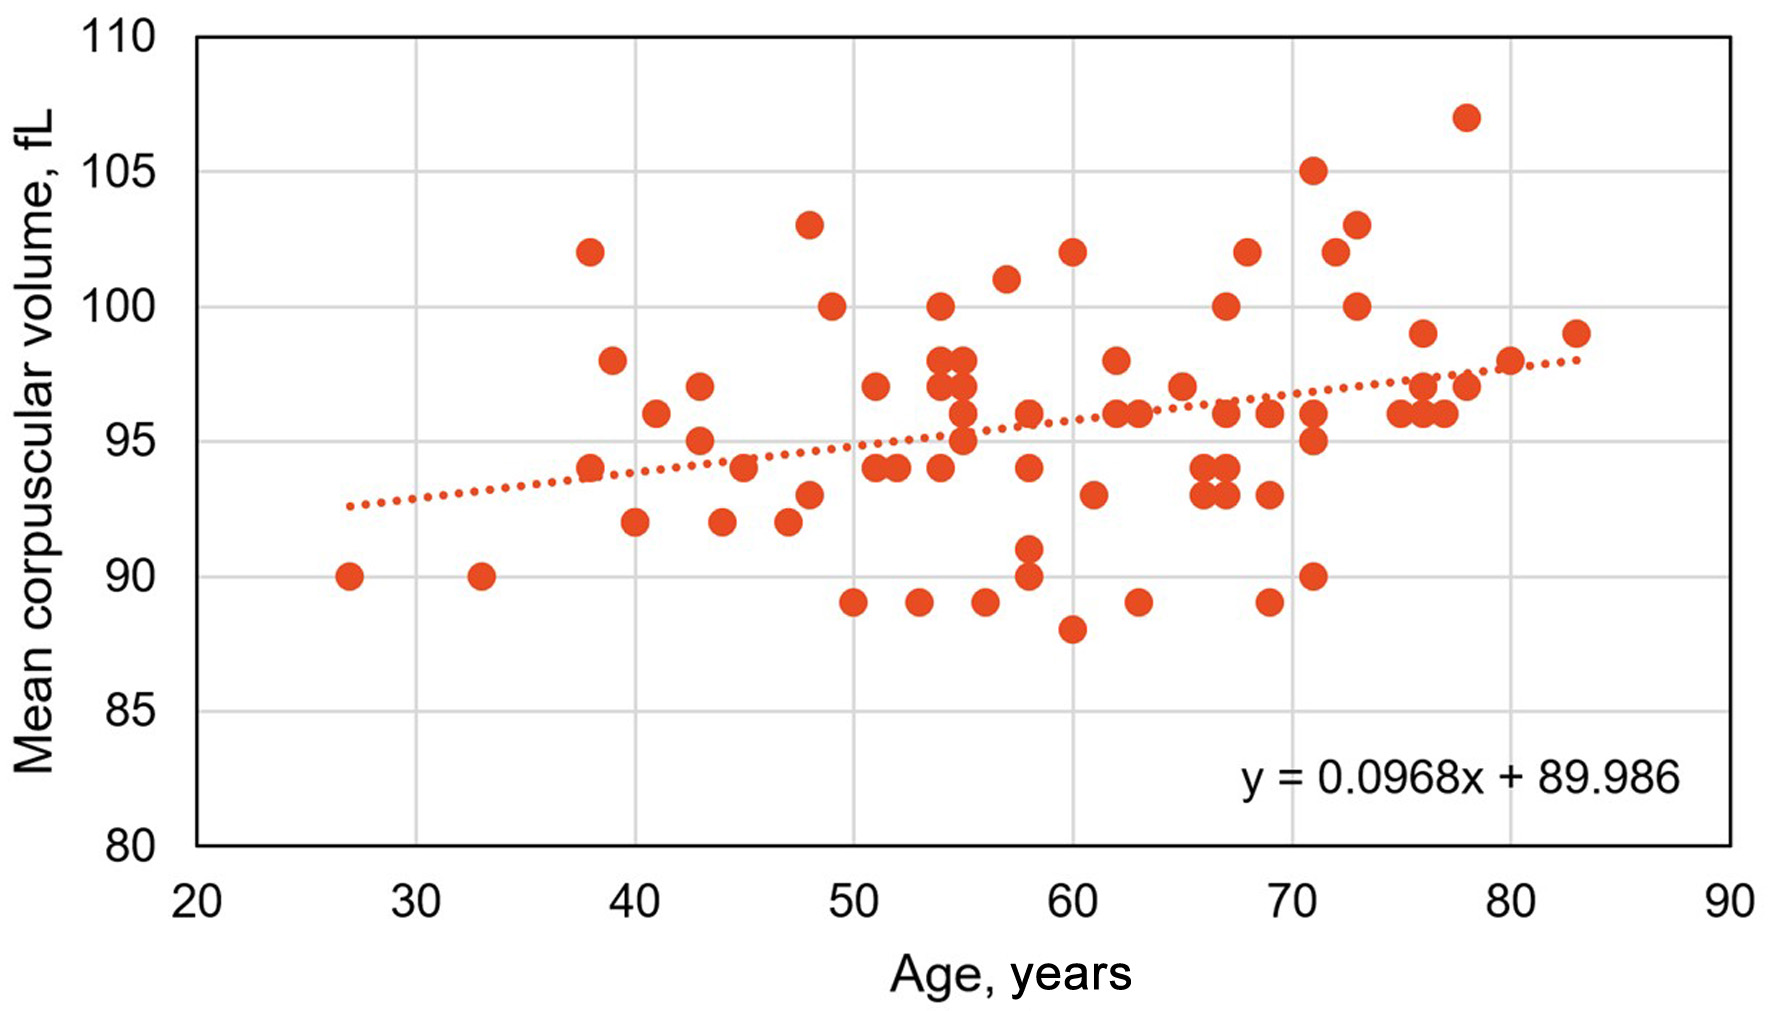
↓ Figure 1. Pearson’s correlation of mean
corpuscular volume vs. age in 74 HFE p.C282Y/p.H63D compound heterozygotes with high iron
phenotypes (r74 = 0.2983; P = 0.0098).
| Journal of Hematology, ISSN 1927-1212 print, 1927-1220 online, Open Access |
| Article copyright, the authors; Journal compilation copyright, J Hematol and Elmer Press Inc |
| Journal website https://jh.elmerpub.com |
Original Article
Volume 15, Number 1, February 2026, pages 13-22
Mean Corpuscular Volume in HFE p.C282Y/p.H63D Compound Heterozygotes With High Iron Phenotypes: Clinical and Laboratory Associations
Figures
Tables
| Screening | Post-screening evaluation | P value | |
|---|---|---|---|
| SD: standard deviation. | |||
| Men (n = 37) | |||
| Mean transferrin saturation, % ± 1 SD | 65 ± 13 | 58 ± 17 | 0.0692 |
| Mean serum ferritin, µg/L ± 1 SD | 529 ± 164 | 531 ± 170 | 0.9684 |
| Women (n = 37) | |||
| Mean transferrin saturation, % ± 1 SD | 59 ± 14 | 53 ± 12 | 0.0594 |
| Mean serum ferritin, µg/L ± 1 SD | 376 ± 195 | 367 ± 201 | 0.8316 |
| Variable | Men (n = 37) | Women (n = 37) | P value |
|---|---|---|---|
| aReference ranges in men and women were 0–40 and 0–31 IU/L, respectively. bReference ranges in men and women were 0–37 and 0–31 IU/L, respectively. cReference ranges in men and women were 11–51 and 7–33 IU/L, respectively. MCP: metacarpophalangeal; SD: standard deviation. | |||
| Mean age, years (SD) | 57 ± 13 | 62 ± 12 | 0.0606 |
| Mean body mass index, kg/m2 (SD) | 28.7 ± 5.0 | 28.0 ± 5.2 | 0.5405 |
| Diabetes reports, % (n) | 24.3 (6) | 5.4 (2) | 0.2611 |
| Mean heme iron intake, mg/day (SD) | 2.4 ± 1.4 | 1.9 ± 1.0 | 0.0549 |
| Median non-heme iron intake, mg/day (range) | 12.3 (4.2, 34.9) | 12.2 (4.3, 43.7) | 0.4822 |
| Median supplemental iron intake, mg/day (range) | 3.9 (0, 40.5) | 3.9 (0, 40.5) | 0.6892 |
| Median alcohol intake, g/day (range) | 5.7 (0, 60.9) | 5.7 (0, 55.8) | 0.7949 |
| Swollen or tender second/third MCP joints, % (n) | 5.4 (2) | 5.4 (2) | ∼1.0000 |
| Mean transferrin saturation, % (SD) | 58 ± 17 | 53 ± 12 | 0.1197 |
| Mean serum ferritin, µg/L (SD) | 531 ± 170 | 366 ± 201 | 0.0003 |
| Mean hemoglobin, g/L | 155 ± 8 | 139 ± 9 | < 0.0001 |
| Mean corpuscular volume, fL (SD) | 95.5 ± 4.0 | 96.0 ± 4.1 | 0.6087 |
| Elevated alanine aminotransferase, % (n)a | 16.2 (6) | 24.3 (9) | 0.5642 |
| Elevated aspartate aminotransferase, % (n)b | 10.8 (4) | 24.3 (9) | 0.2210 |
| Elevated gamma-glutamyl transpeptidase, % (n)c | 10.8 (4) | 40.5 (15) | 0.0068 |
| Low risk, % (n) | Intermediate risk, % (n) | High risk, % (n) | P value | |
|---|---|---|---|---|
| aLow risk (FIB-4 < 1.3); intermediate risk (FIB-4 1.3–2.67); and high risk (FIB-4 > 2.67). bLow risk (APRI < 0.5); intermediate risk (APRI 0.5–1.5); and high risk (APRI > 1.5). cOne-way ANOVA P test. dUnpaired Student’s t-test (two-tailed). APRI: AST-to-platelet ratio index; FIB-4: fibrosis-4 index; MCV: mean corpuscular volume; SD: standard deviation. | ||||
| FIB-4a | 56.5 (26) | 32.6 (15) | 10.9 (5) | - |
| Mean MCV, fL (SD) | 95.7 ± 3.5 | 96.3 ± 5.6 | 97.0 ± 5.1 | 0.8204c |
| APRIb | 78.3 (36) | 21.7 (10) | 0 (0) | - |
| Mean MCV, fL (SD) | 96.4 ± 4.0 | 94.8 ± 5.5 | - | 0.3140d |
| Variable | Pearson’s coefficient r | Spearman’s coefficient r | P value |
|---|---|---|---|
| aSee Figure 1. bSee Figure 2. | |||
| Age, years | 0.2983 | - | 0.0098a |
| Body mass index, kg/m2 | −0.2299 | - | 0.0488 |
| Heme iron intake, mg/day | −0.2478 | - | 0.0333 |
| Non-heme iron intake, mg/day | - | −0.0604 | 0.6092 |
| Supplemental iron intake, mg/day | - | 0.0742 | 0.5300 |
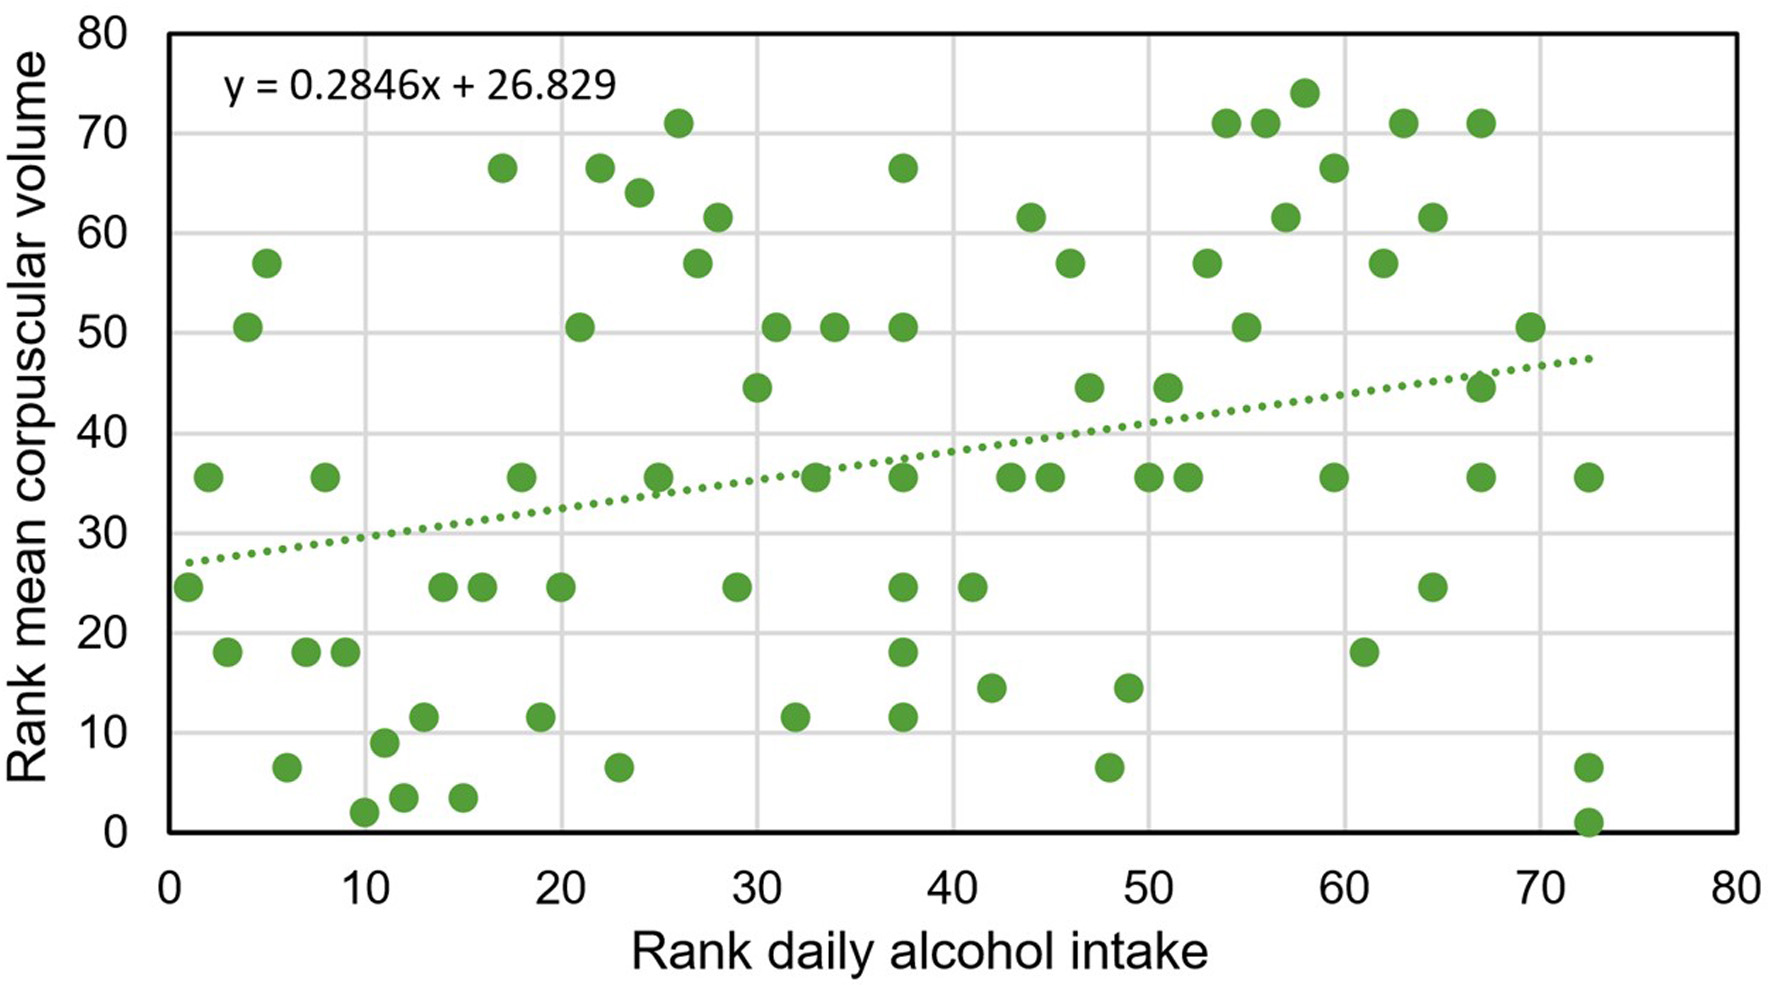
| Alcohol intake, g/day | - | 0.2860 | 0.0135b |
| Transferrin saturation, % | 0.0667 | - | 0.5723 |
| Serum ferritin, µg/L | −0.0403 | - | 0.7296 |
| Variable | Mean MCV, fL ± SD with variable (n) | Mean MCV, fL ± SD without variable (n) | P value |
|---|---|---|---|
| MCP: metacarpophalangeal; MCV: mean corpuscular volume; SD: standard deviation. | |||
| Male sex | 95.5 ± 4.0 (37) | 96.0 ± 4.1 (37) | 0.6087 |
| Diabetes reports | 94.6 ± 3.3 (8) | 95.8 ± 4.2 (66) | 0.4045 |
| Swollen or tender second/third MCP joints | 97.0 ± 5.5 (4) | 95.6 ± 4.0 (70) | 0.6768 |