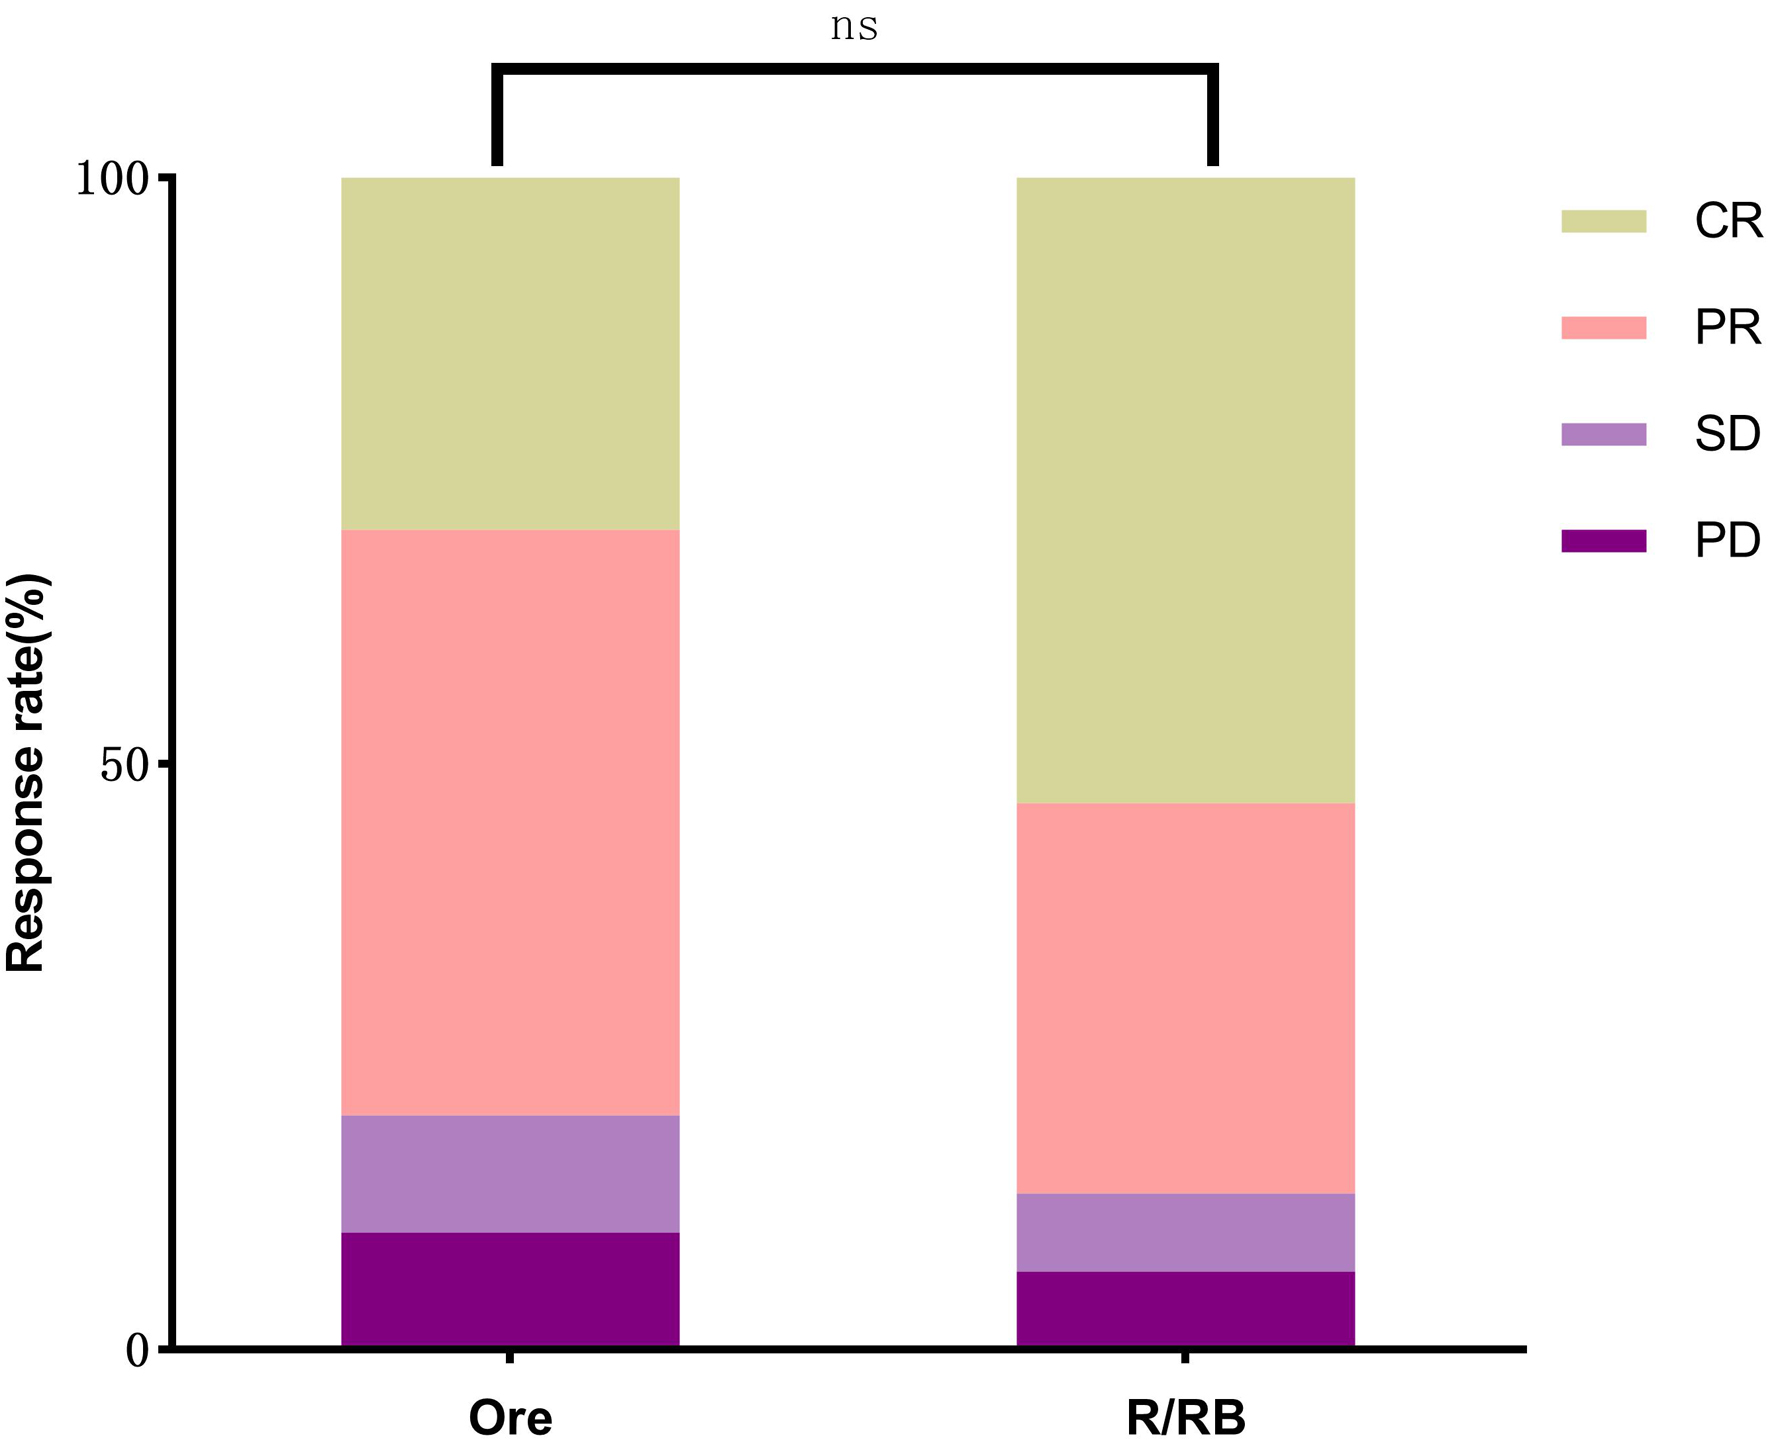
↓ Figure 1. Comparison of CR (30.00% vs. 53.3%),
PR (50.00% vs. 33.33%), SD (10.00% vs. 6.66%), and PD (10.00% vs. 6.66%) between the orelabrutinib and
control groups (P > 0.05). CR: complete response; PD: progressive disease; PR: partial response; SD:
stable disease.
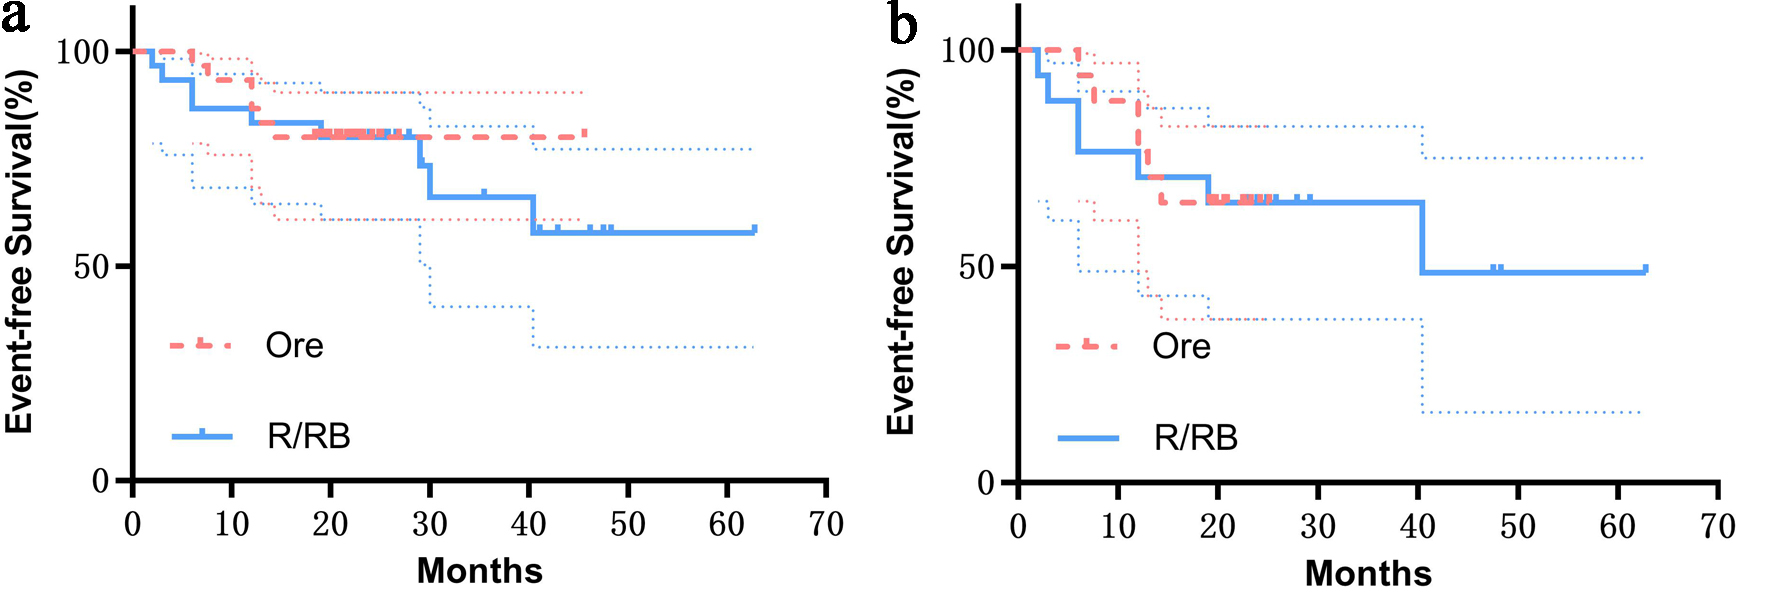
↓ Figure 2. (a) Overall EFS of the two groups (P
= 0.86). (b) EFS of patients after R/R-CT treatment (P = 0.75). Shaded bands denote 95% confidence
intervals, and no significant statistical differences were observed in either case. EFS: event-free
survival; Ore: orelabrutinib; R/BR: rituximab/bendamustine plus rituximab; R/R-CT:
rituximab/rituximab-based chemotherapy.