Figures
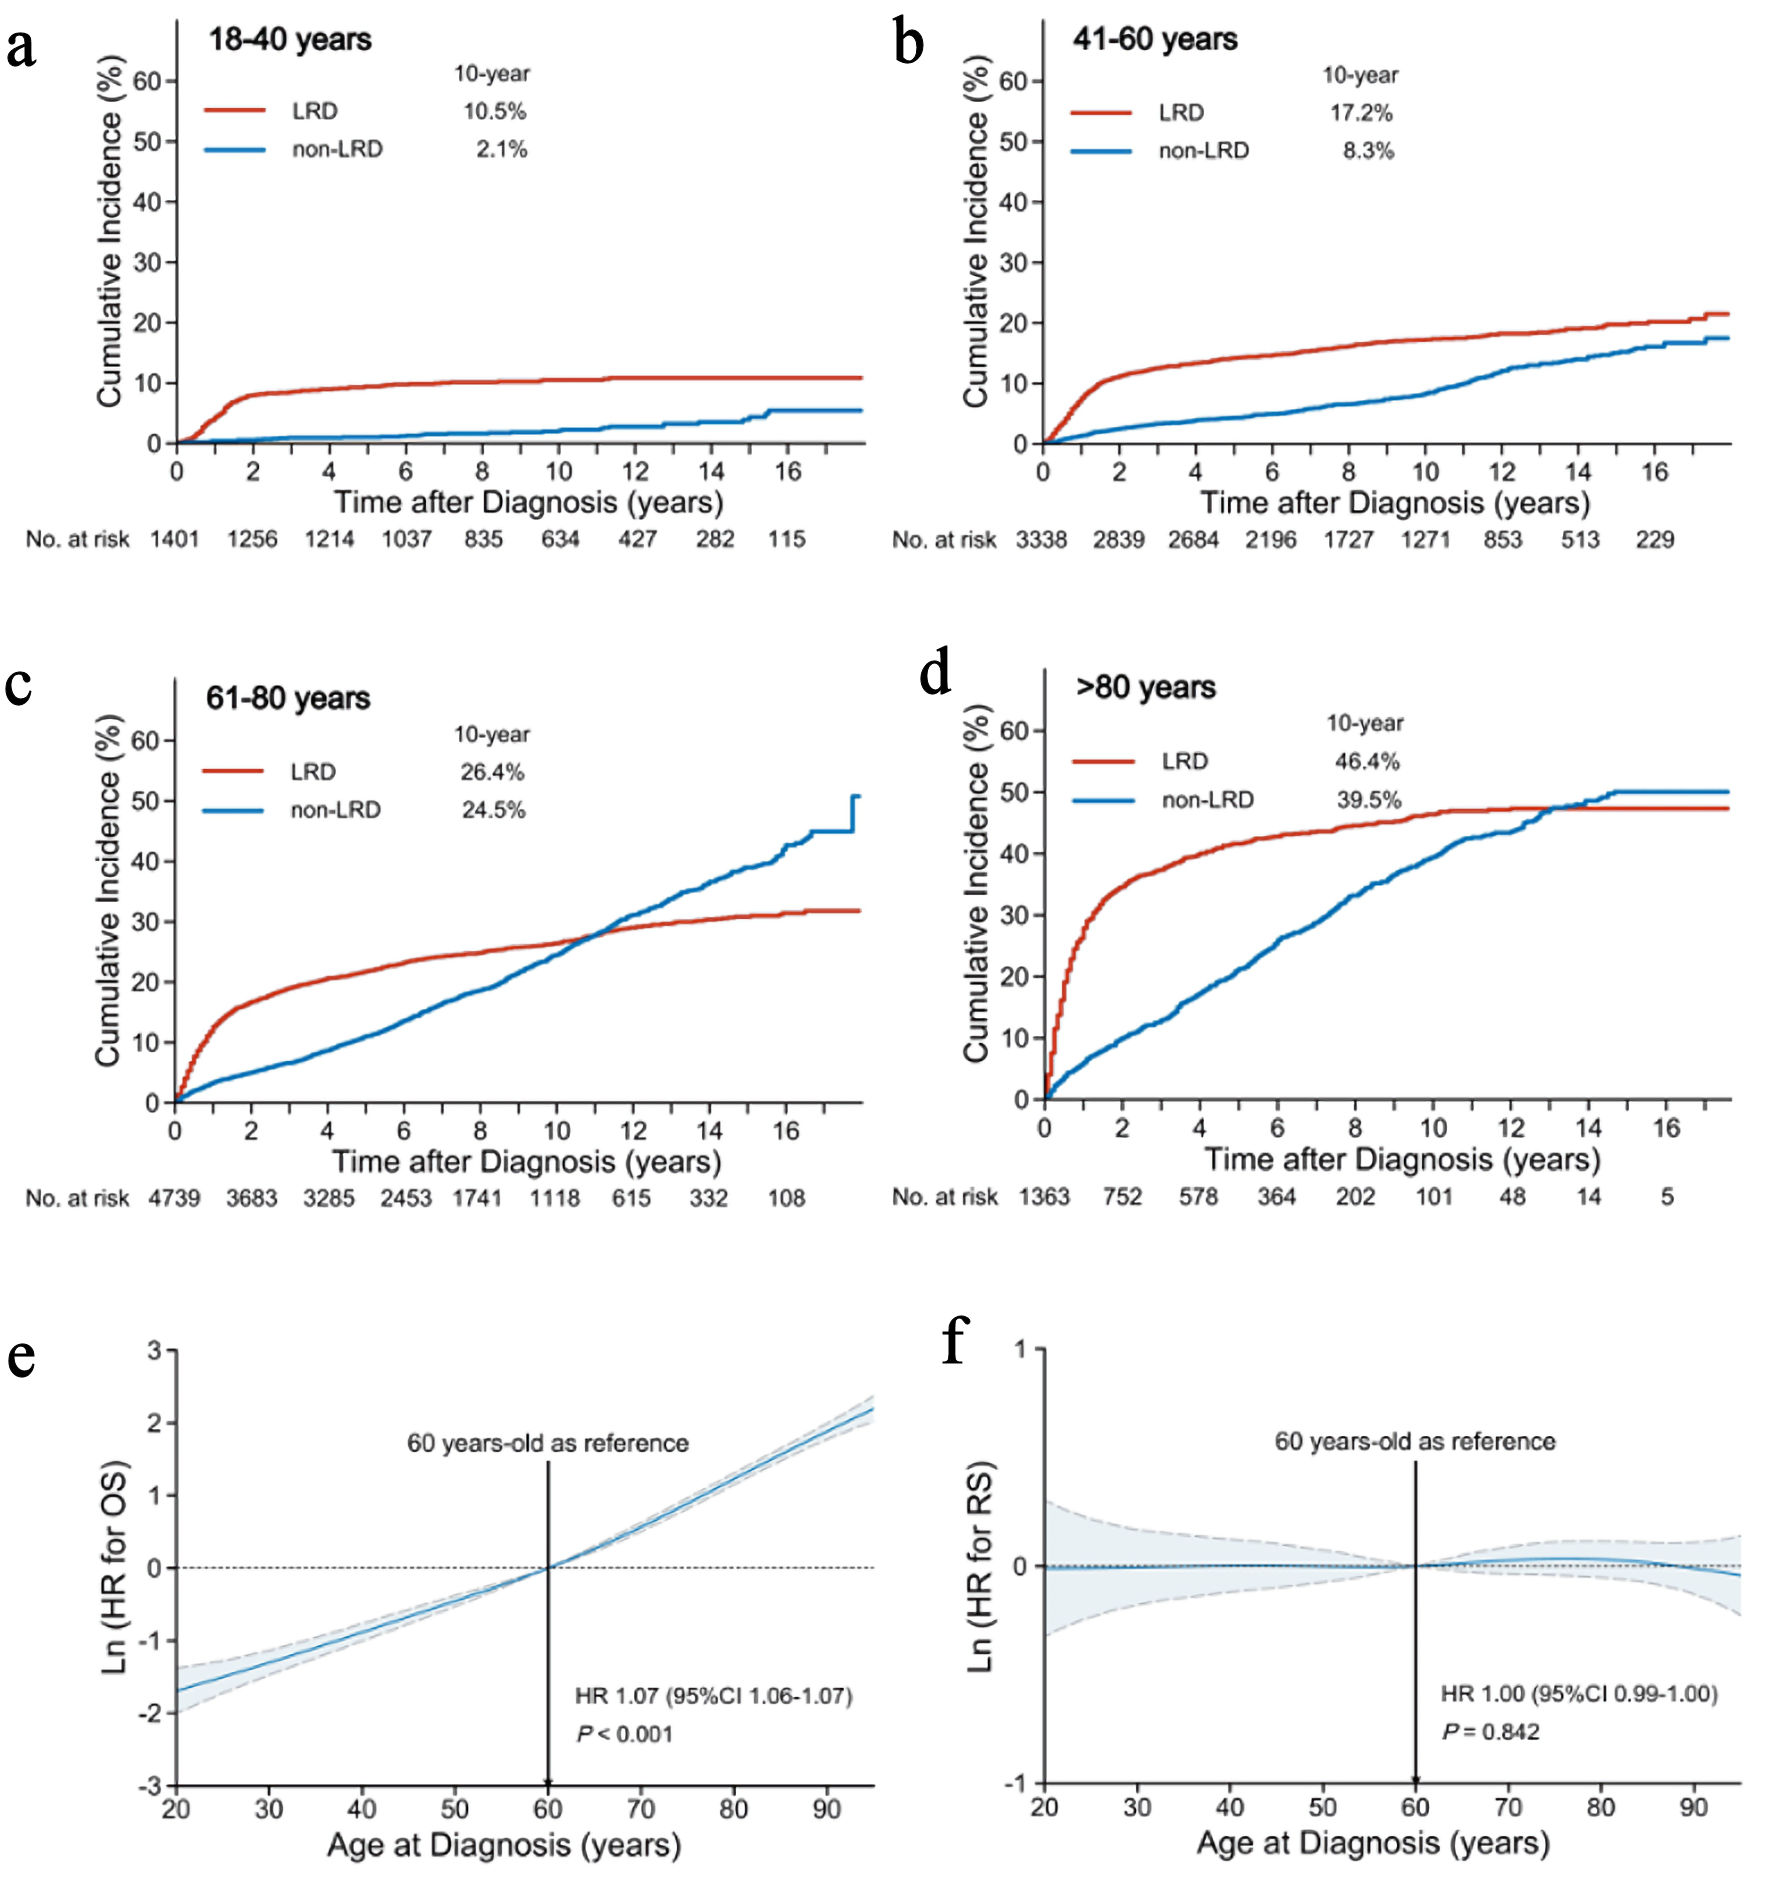
↓ Figure 1. Influence of age on causes of death
and survival. Cumulative incidence of LRDs and non-LRDs in the age groups of < 40 years (a),
41–60 years (b), 61–80 years (c), and > 80 years (d). Association of age (as a
continuous variable) with OS (e) and RS (f) based on the reference age of 60 years. The mean HRs and 95%
CIs are represented by solid and dashed lines, respectively. LRD: lymphoma-related death; non-LRD:
non-lymphoma-related death; OS: overall survival; RS: relative survival; CI: confidence interval; HR:
hazard ratio.
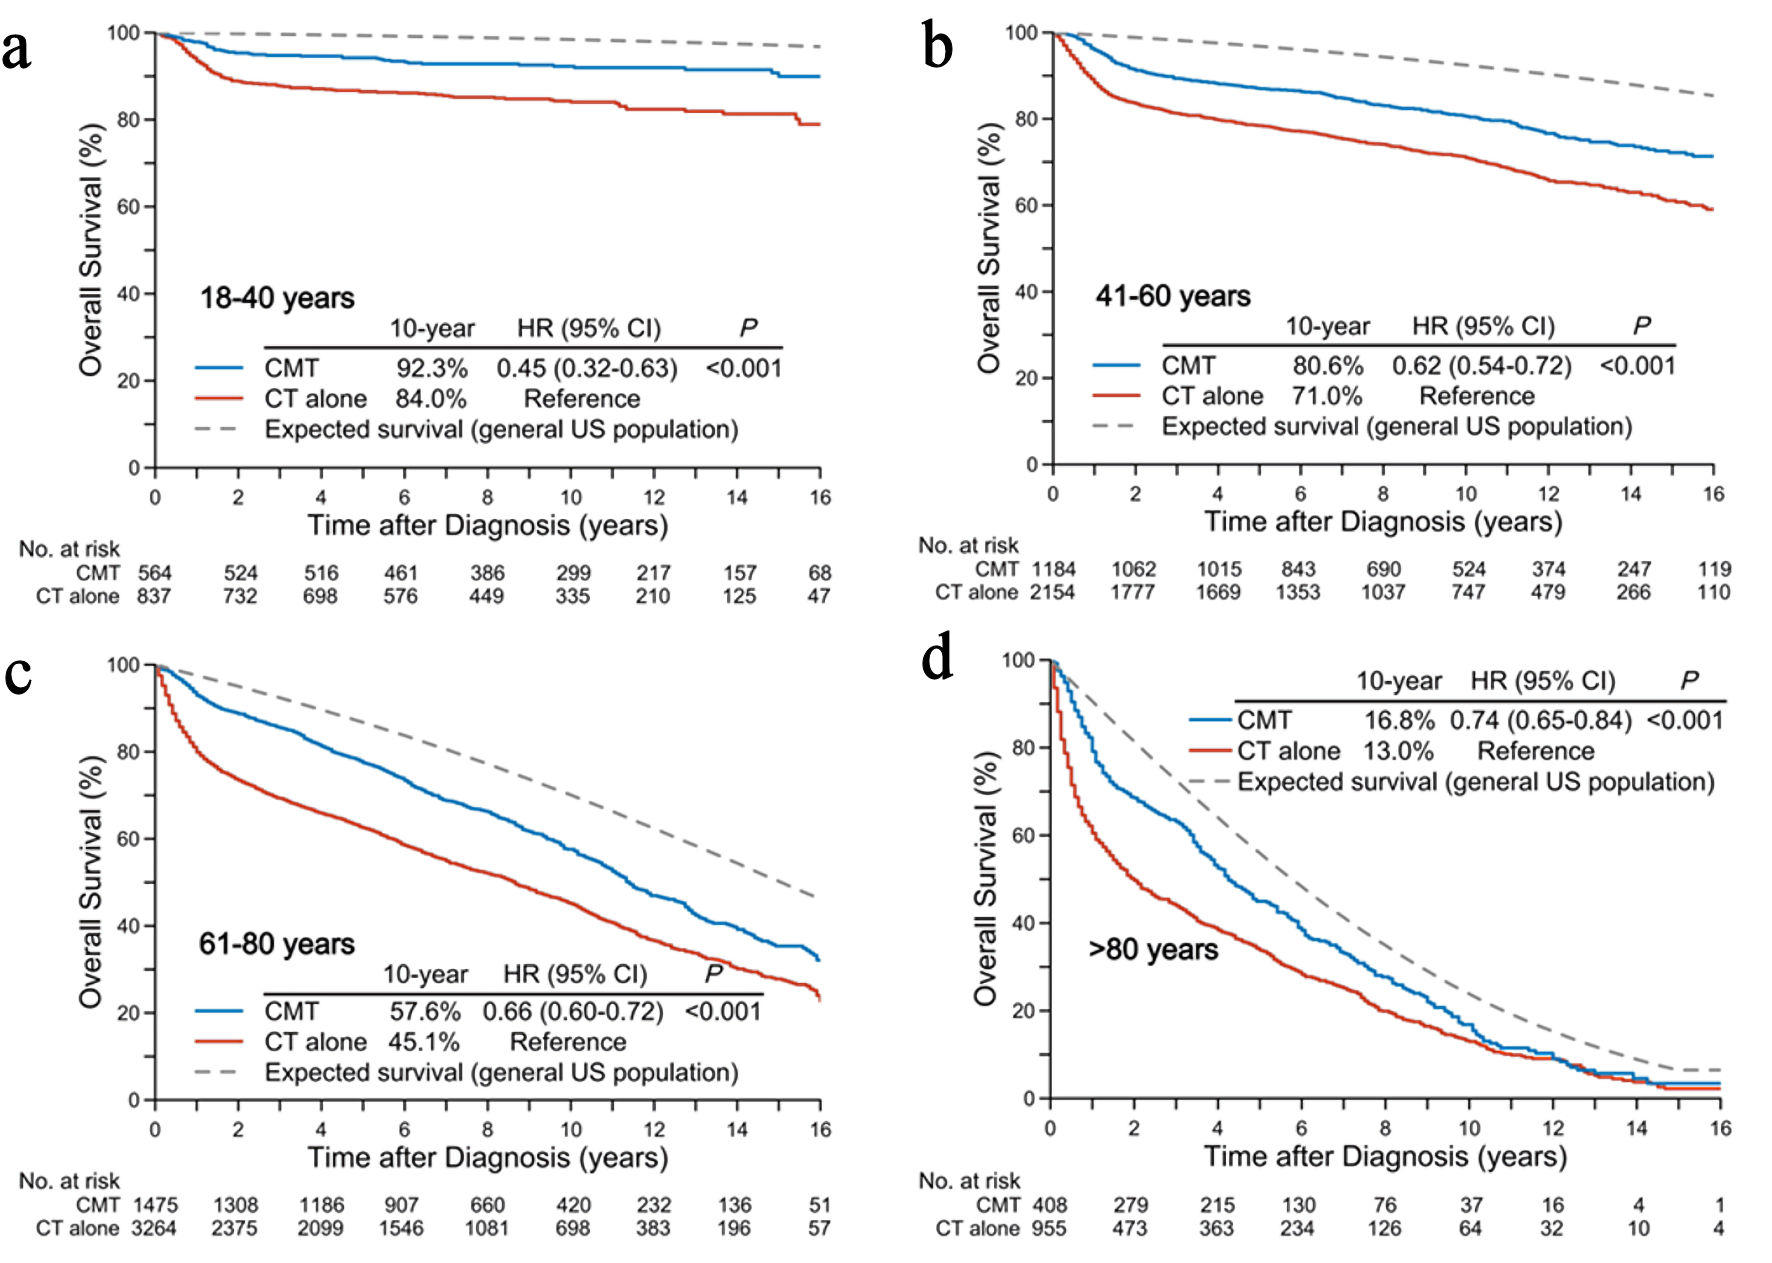
↓ Figure 2. Crude overall and expected survival
rates in the general US population according to age groups: < 40 years (a), 41–60 years (b),
61–80 years (c), and > 80 years (d). CMT: combined-modality treatment; CT: chemotherapy.
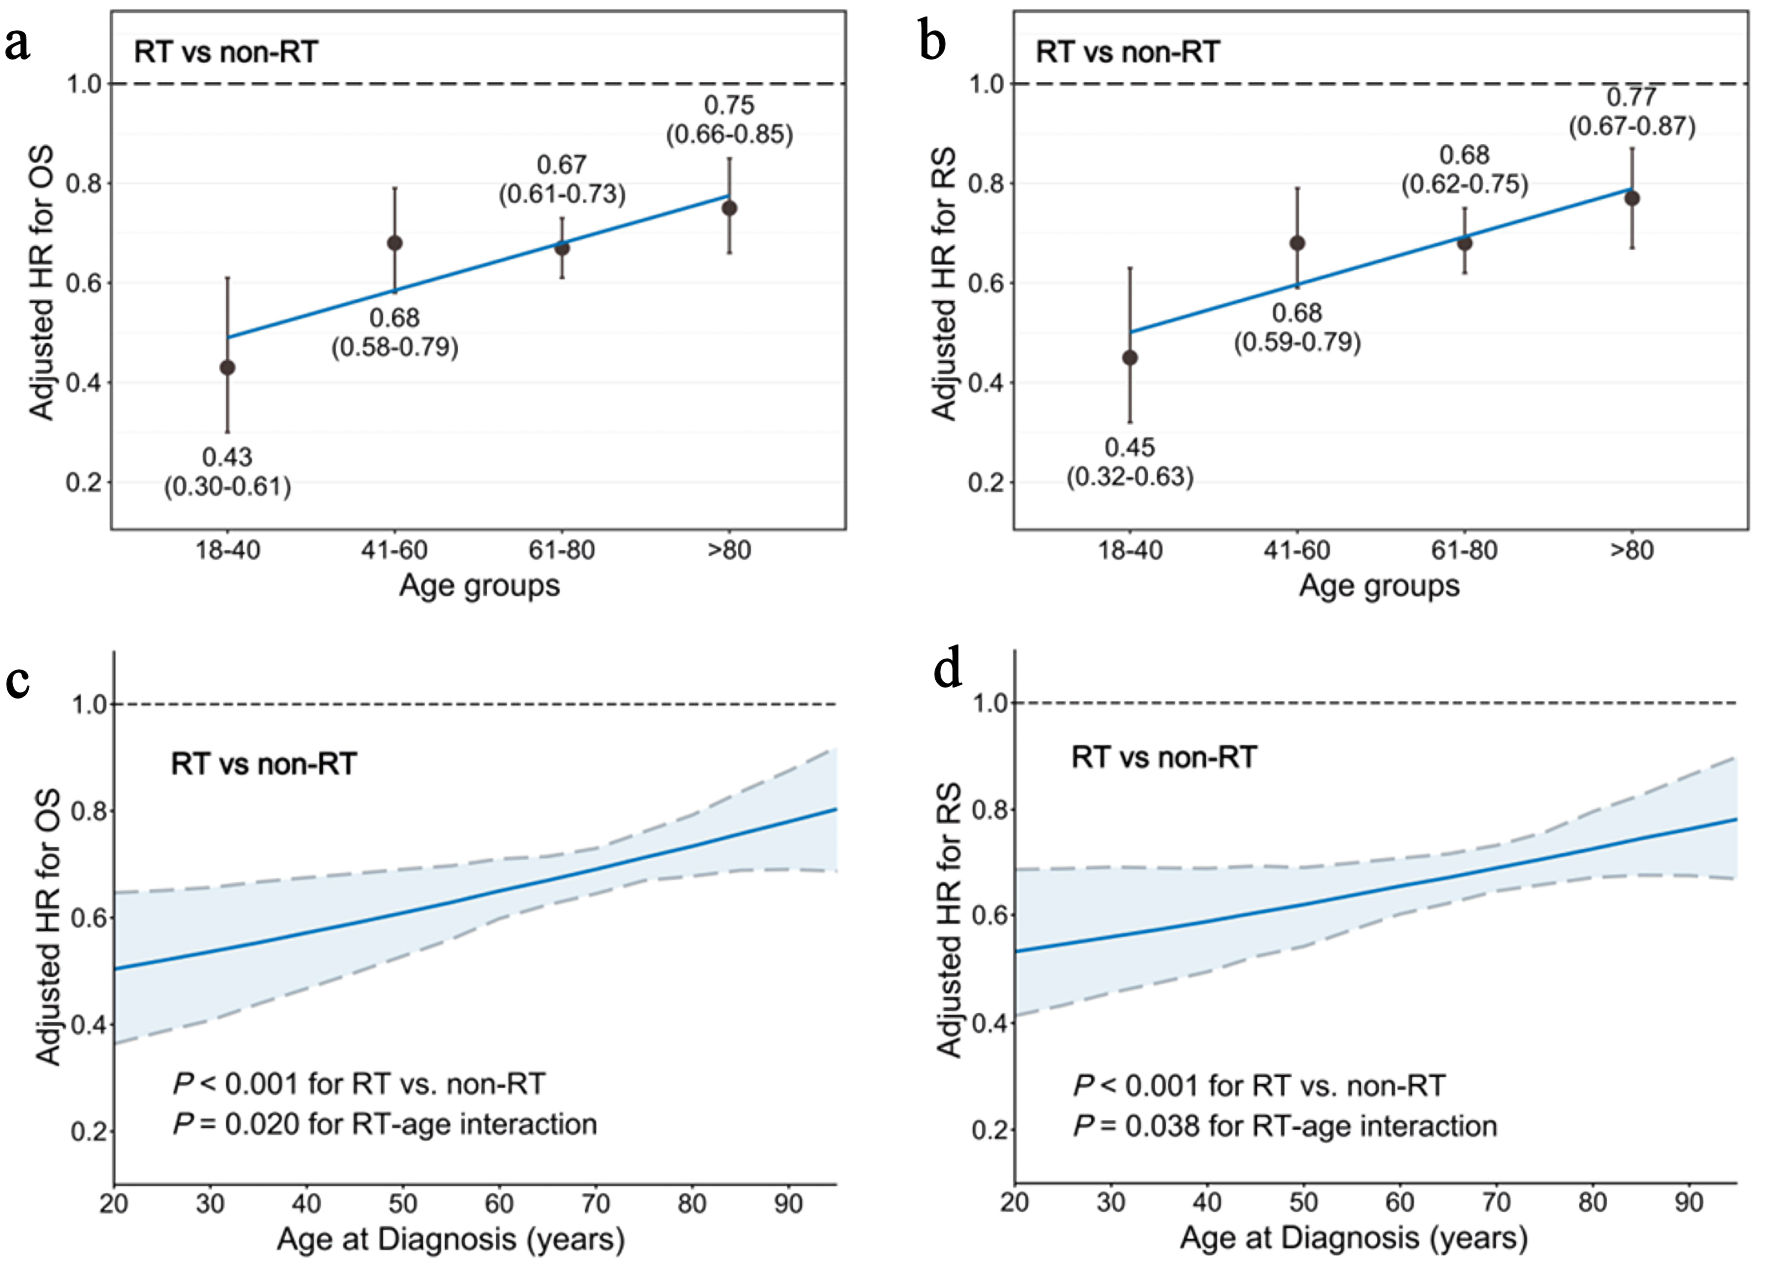
↓ Figure 3. Interaction between age and RT on
survival benefits after balancing through IPTW and controlling for clinical covariates. (a) HR for OS
(RT vs. non-RT) in the four age groups. (b) HR for RS (RT vs. non-RT) in the four age groups. (c) HR for
OS (RT vs. non-RT) according to age as a continuous variable. The simulated plot for the interaction
between age and OS efficacy of RT depicts the HR for OS in patients treated with or without RT. (d) HR
for RS (RT vs. non-RT) according to age as a continuous variable. The simulated plot for the interaction
between age and RS efficacy of RT depicts the HR for RS in patients treated with or without RT. HR:
hazard ratio; IPTW: inverse probability of treatment weighting; OS: overall survival; RS: relative
survival; RT: radiotherapy.
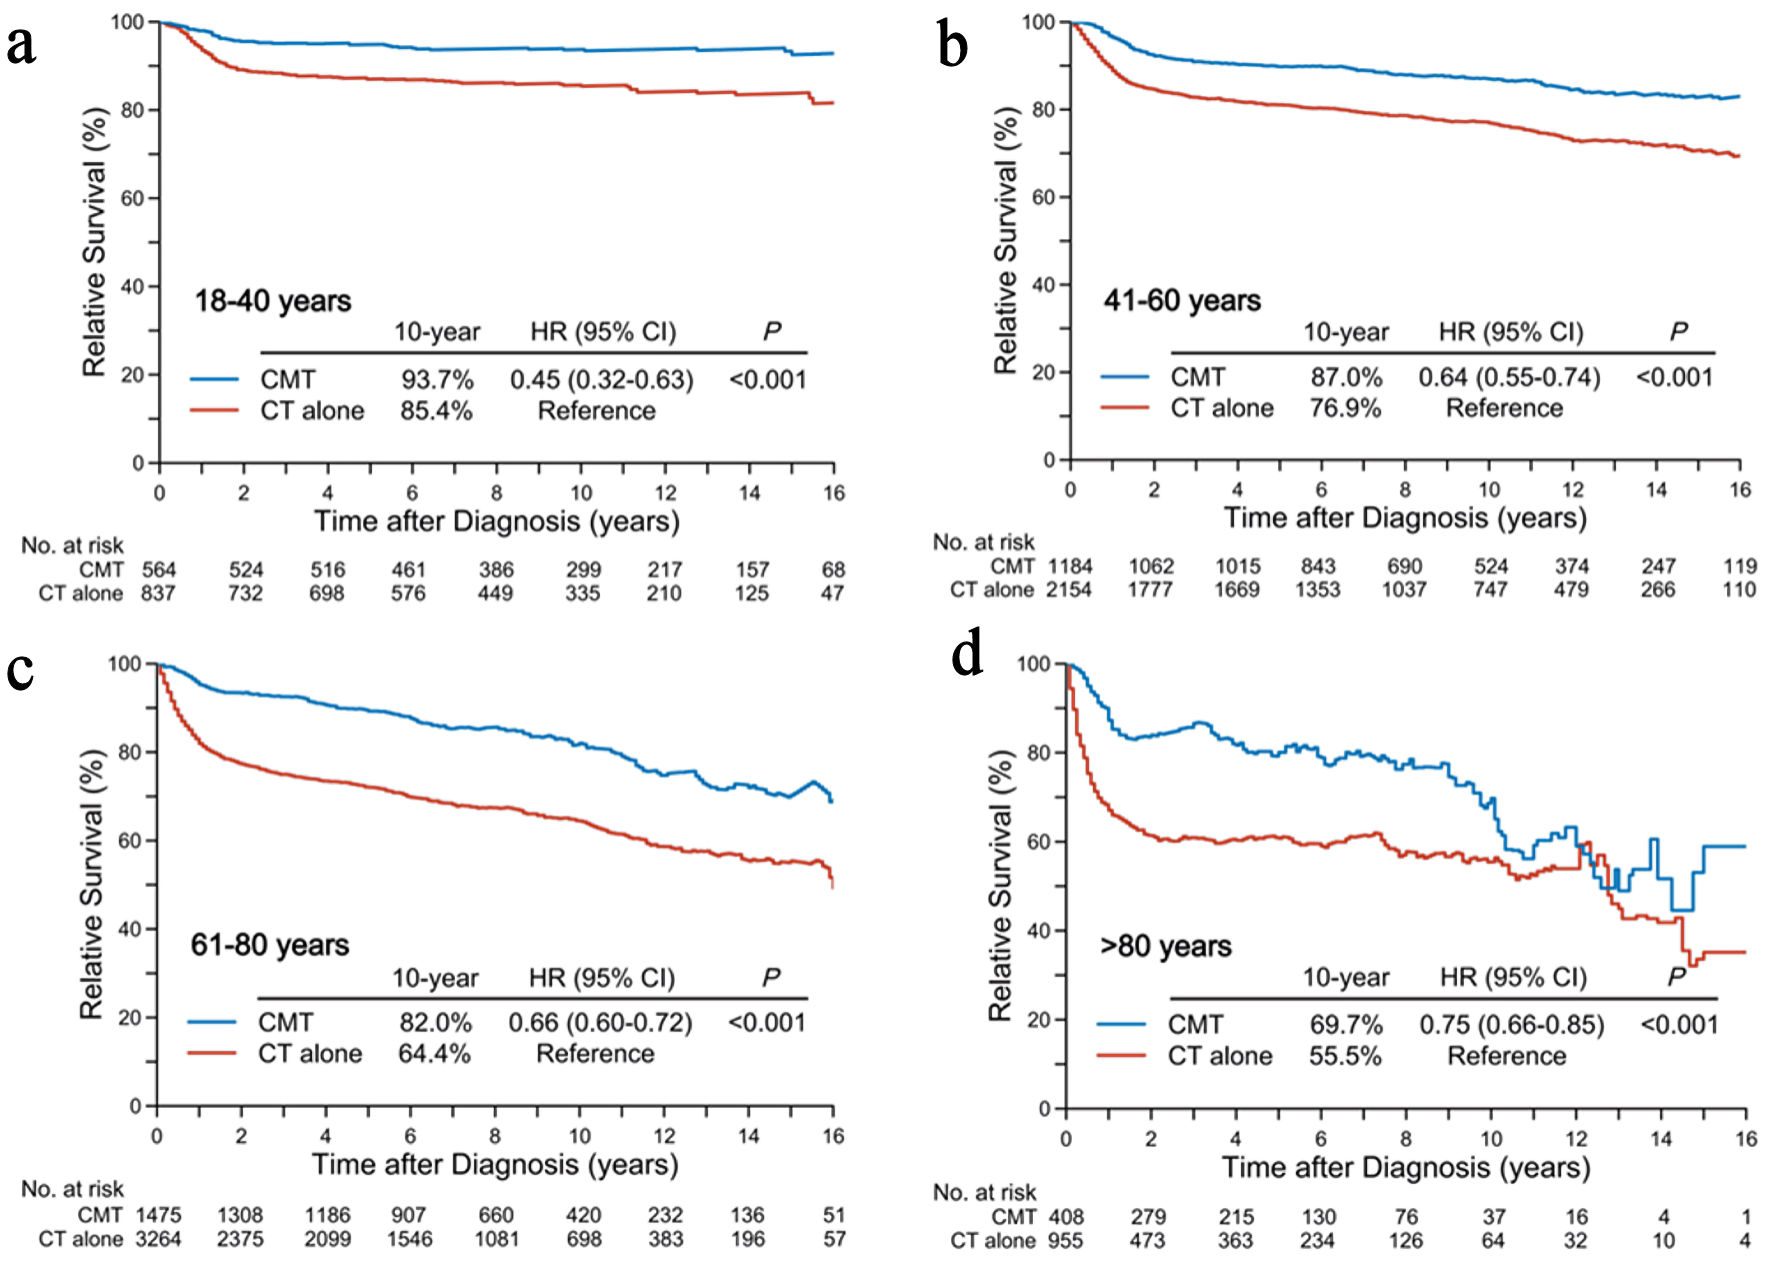
↓ Figure 4. Relative survival differences in
patients receiving initial CMT versus chemotherapy alone according to age groups: < 40 years (a),
41–60 years (b), 61–80 years (c), and > 80 years (d). CMT: combined-modality treatment;
CT: chemotherapy.
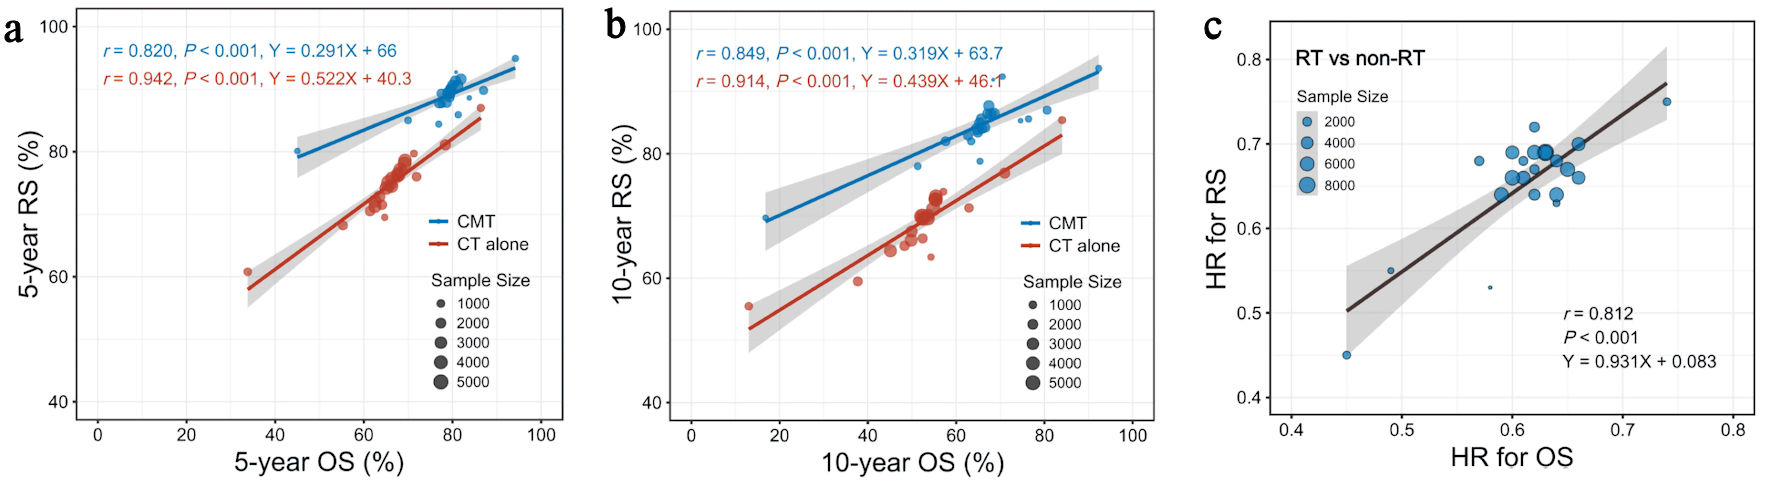
↓ Figure 5. Linear association of OS and RS
benefits at the treatment arm level. (a) Linear associations between 5-year OS and 5-year RS rates in
subgroups stratified by clinical factors and age. (b) Linear associations between 10-year OS and 10-year
RS rates in subgroups stratified by clinical factors and age. (c) Linear associations between HR (RT vs.
non-RT) for OS and RS across subgroups stratified by clinical factors and age. CMT: combined-modality
treatment; CT: chemotherapy; HR: hazard ratio; OS: overall survival; RS: relative survival; RT:
radiotherapy.
Table
↓ Table 1. Baseline Characteristics of Early-Stage DLBCL Patients,
Stratified by Age Groups at Diagnosis (2002–2015)
|
Characteristic |
18–40 years, n (%) |
41–60 years, n (%) |
61–80 years, n (%) |
>
80 years, n (%) |
P
|
| DLBCL: diffuse large B-cell lymphoma; CMT: combined modality treatment; CT:
chemotherapy; LRD: lymphoma-related death. |
| Total |
1,401 (100) |
3,338 (100) |
4,739 (100) |
1,363 (100) |
|
| Sex |
|
|
|
|
< 0.001 |
| Male |
756 (54.0) |
2,009 (60.2) |
2,454 (51.8) |
622 (45.6) |
|
| Female |
645 (46.0) |
1,329 (39.8) |
2,285 (48.2) |
741 (54.4) |
|
| Race |
|
|
|
|
< 0.001 |
| White |
1,044 (74.5) |
2,659 (79.7) |
3,988 (84.2) |
1,203 (88.3) |
|
| Black |
182 (13.0) |
335 (10.0) |
255 (5.4) |
35 (2.6) |
|
| Other/unknown |
175 (12.5) |
344 (10.3) |
496 (10.5) |
125 (9.2) |
|
| Stage |
|
|
|
|
0.001 |
| I |
649 (46.3) |
1,515 (45.4) |
2,335 (49.3) |
681 (50.0) |
|
| II |
752 (53.7) |
1,823 (54.6) |
2,404 (50.7) |
682 (50.0) |
|
| B symptoms |
|
|
|
|
< 0.001 |
| Yes |
366 (26.1) |
695 (20.8) |
862 (18.2) |
246 (18.0) |
|
| No |
766 (54.7) |
1,865 (55.9) |
2,709 (57.2) |
765 (56.1) |
|
| Unknown |
269 (19.2) |
778 (23.3) |
1,168 (24.6) |
352 (25.8) |
|
| Primary site |
|
|
|
|
< 0.001 |
| Nodal |
969 (69.2) |
2,101 (62.9) |
2,783 (58.7) |
766 (56.2) |
|
| Extranodal |
432 (30.8) |
1,237 (37.1) |
1,956 (41.3) |
597 (43.8) |
|
| Marital status |
|
|
|
|
< 0.001 |
| Married |
605 (43.2) |
2,030 (60.8) |
2,943 (62.1) |
618 (45.3) |
|
| Divorced/separated/widowed |
63 (4.5) |
455 (13.6) |
1,083 (22.9) |
599 (43.9) |
|
| Unmarried/single |
674 (48.1) |
724 (21.7) |
491 (10.4) |
87 (6.4) |
|
| Unknown |
59 (4.2) |
129 (3.9) |
222 (4.7) |
59 (4.3) |
|
| Period |
|
|
|
|
0.026 |
| 2002–2008 |
668 (47.7) |
1,550 (46.4) |
2,079 (43.9) |
631 (46.3) |
|
| 2009–2015 |
733 (52.3) |
1,788 (53.6) |
2,660 (56.1) |
732 (53.7) |
|
| Therapy |
|
|
|
|
< 0.001 |
| CT alone |
837 (59.7) |
2,154 (64.5) |
3,264 (68.9) |
955 (70.1) |
|
| CMT |
564 (40.3) |
1,184 (35.5) |
1,475 (31.1) |
408 (29.9) |
|
| Final outcome |
|
|
|
|
< 0.001 |
| Alive |
1,222 (87.2) |
2,446 (73.3) |
2,296 (48.4) |
229 (16.8) |
|
| LRD |
143 (10.2) |
570 (17.1) |
1,256 (26.5) |
616 (45.2) |
|
| Death from other cause |
36 (2.6) |
322 (9.6) |
1,187 (25.0) |
518 (38.0) |
|