Figures
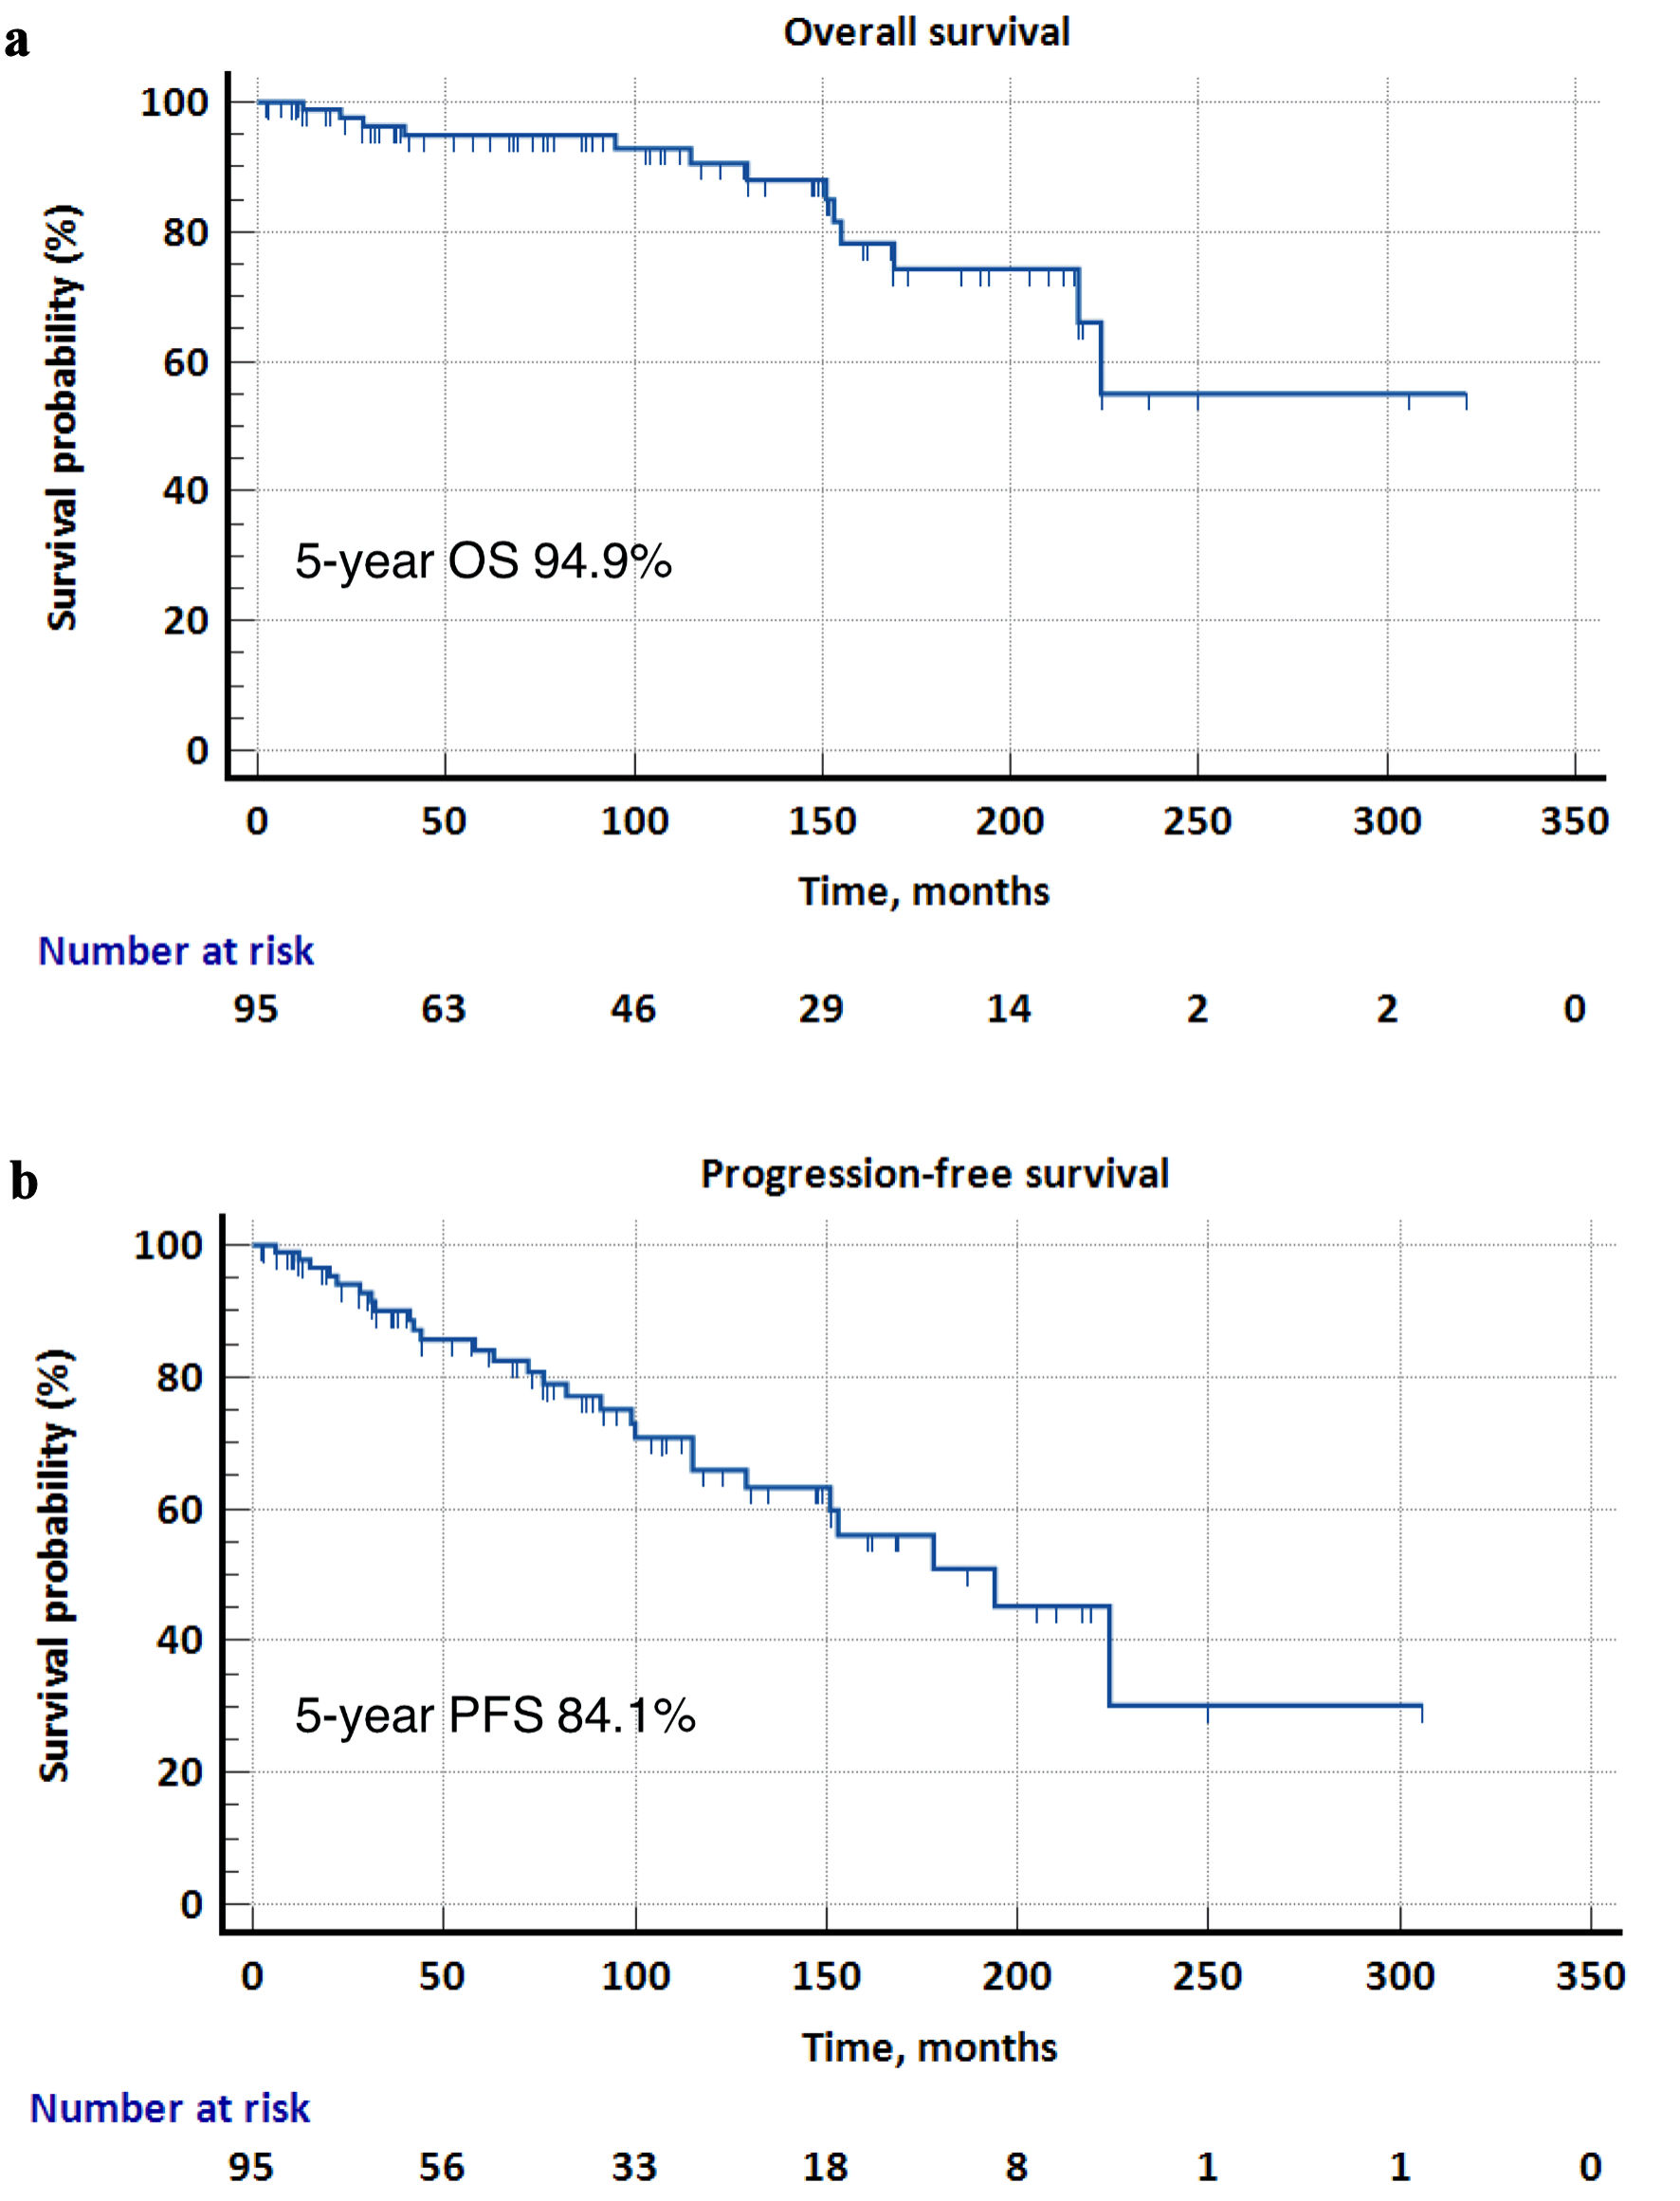
↓ Figure 1. Kaplan-Meier survival curves for
overall survival (OS) and progression-free survival (PFS) in the overall cohort. (a) The 5-year OS was
94.9%, and the median OS was not reached. (b) The 5-year PFS was 84.1%, and the median PFS was 194
months.
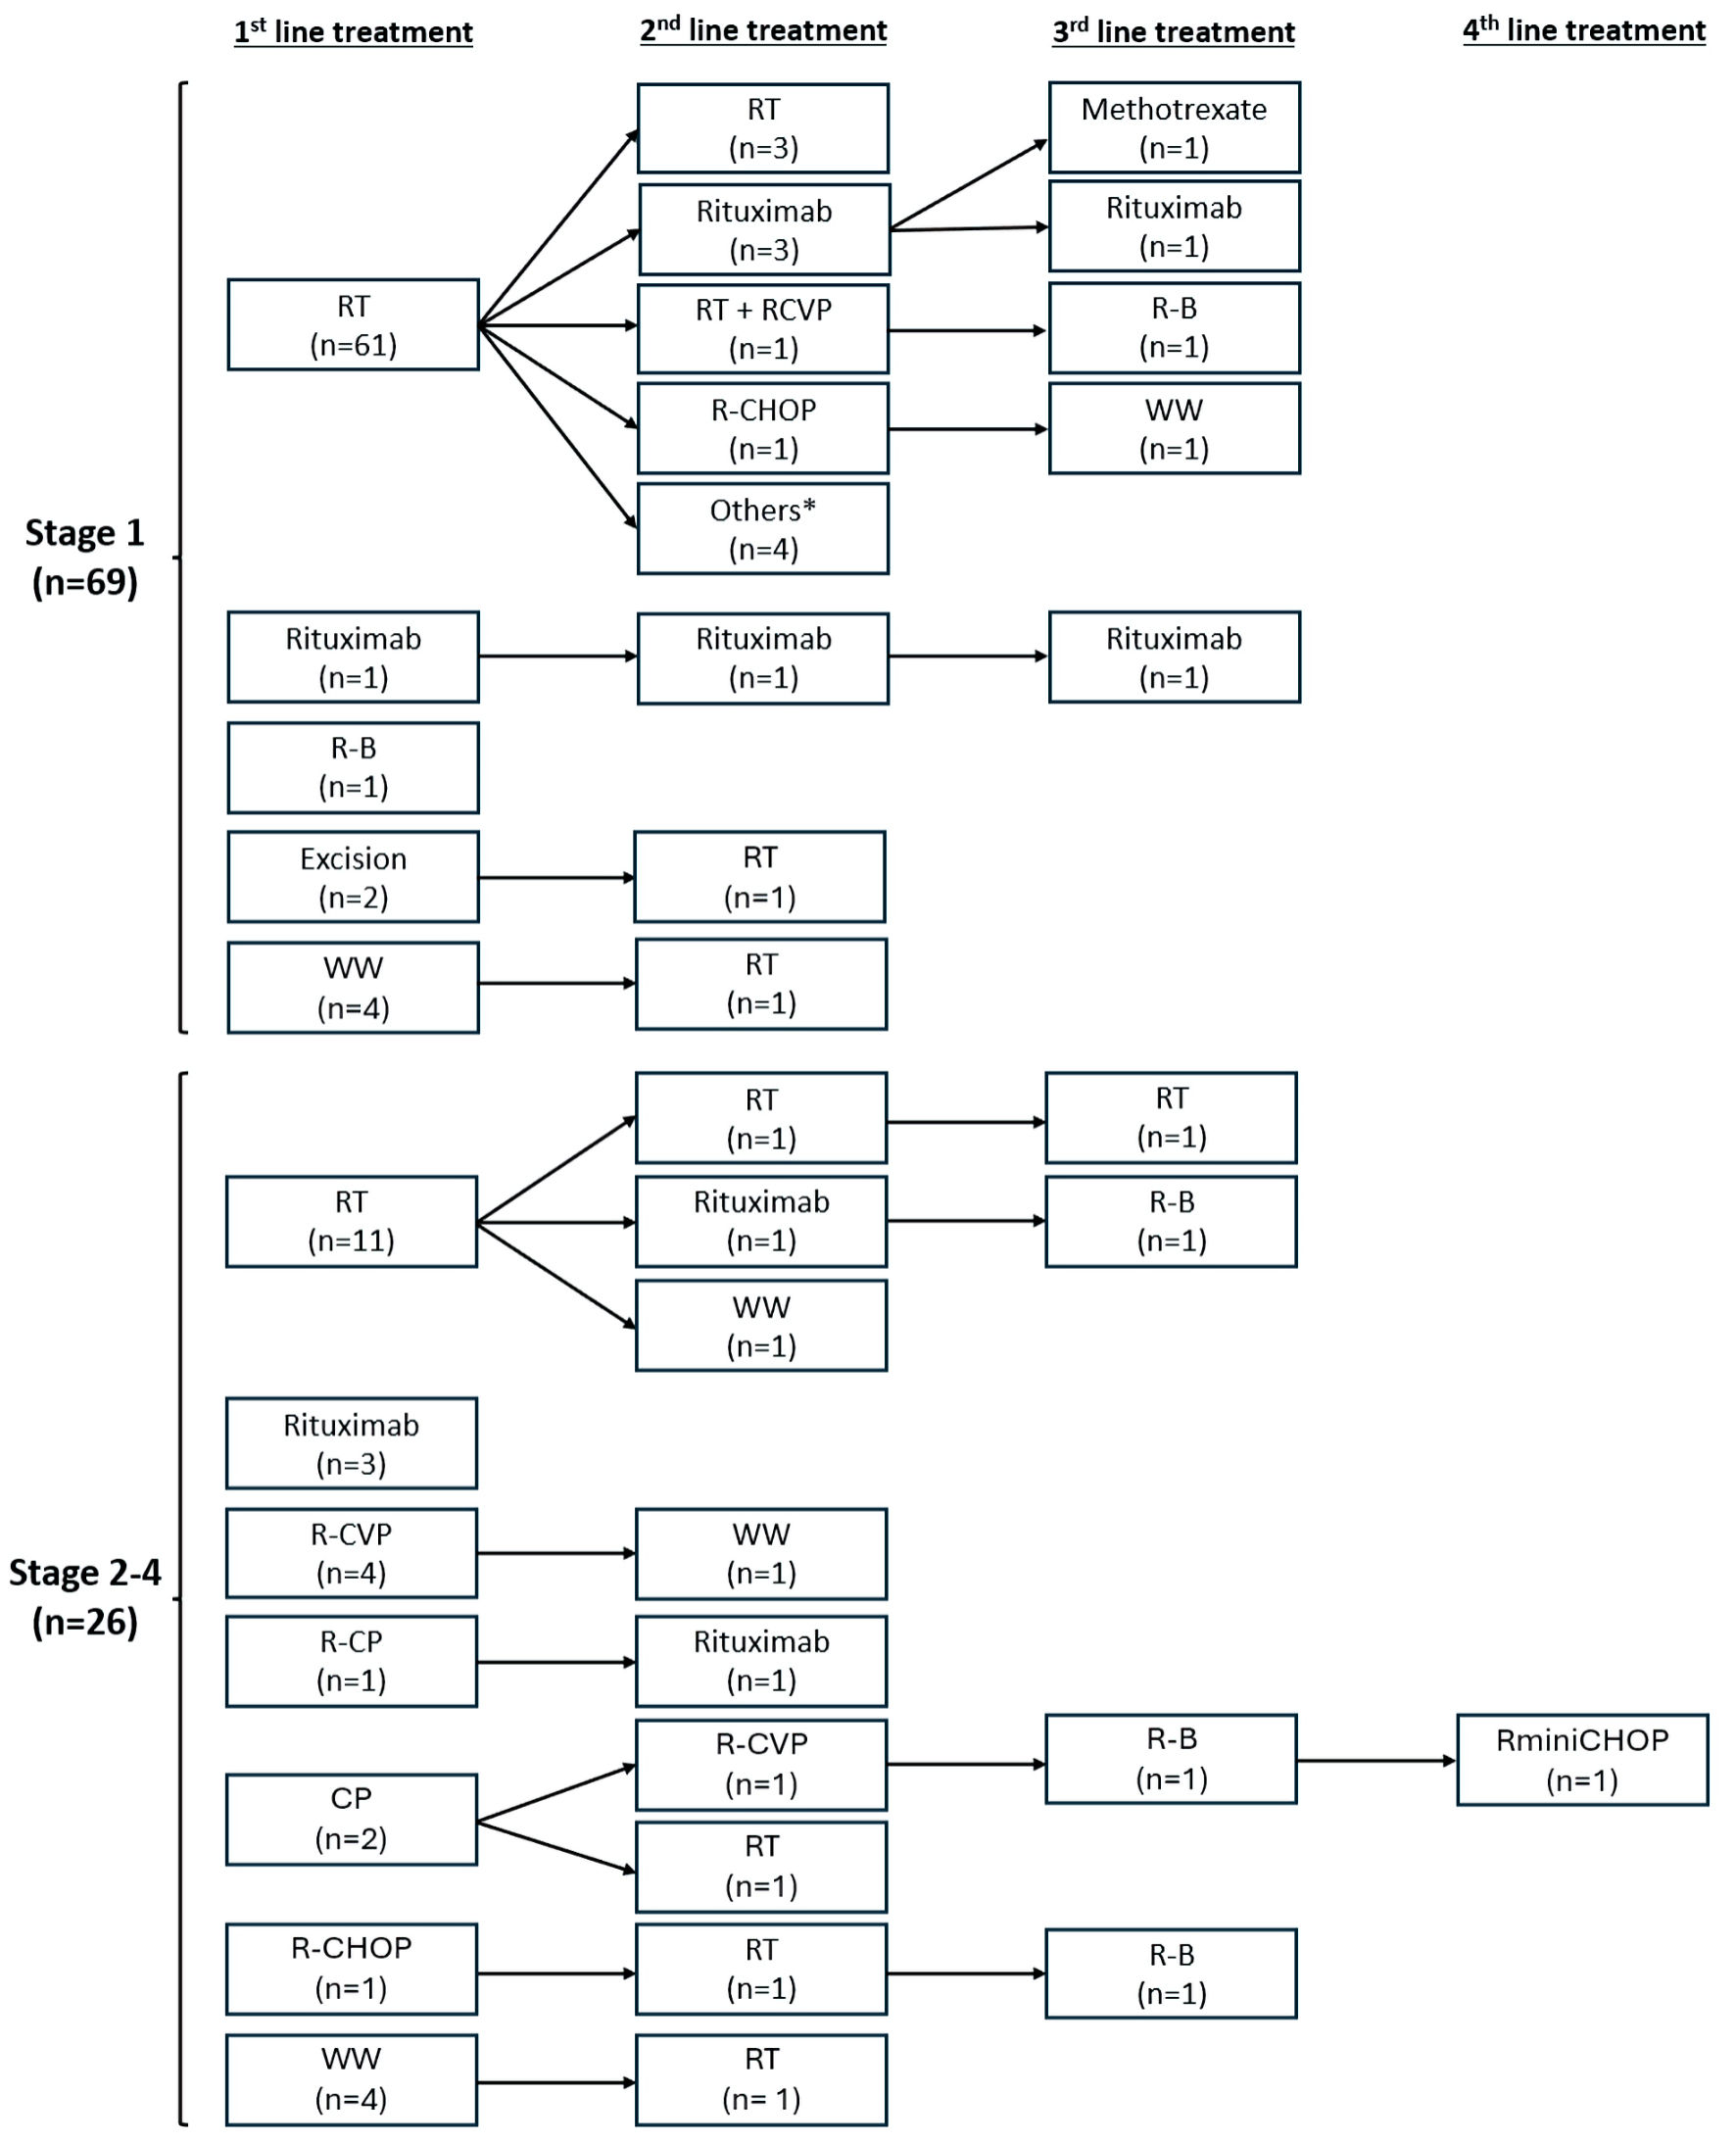
↓ Figure 2. First- and subsequent-line treatment
therapies stratified by disease stage. Others: R-B (n = 2), bendamustine alone (n = 1), CVP (n = 1). CP:
chlorambucil, prednisone; R-CP: rituximab, chlorambucil, prednisone; CVP: cyclophosphamide, vincristine,
prednisone; R-CVP: rituximab, cyclophosphamide, vincristine, prednisone; R-CHOP: rituximab,
cyclophosphamide, doxorubicin, vincristine, prednisone; RminiCHOP: rituximab plus reduced dose CHOP;
R-B: rituximab, bendamustine; RT: radiation therapy; WW: watchful waiting.
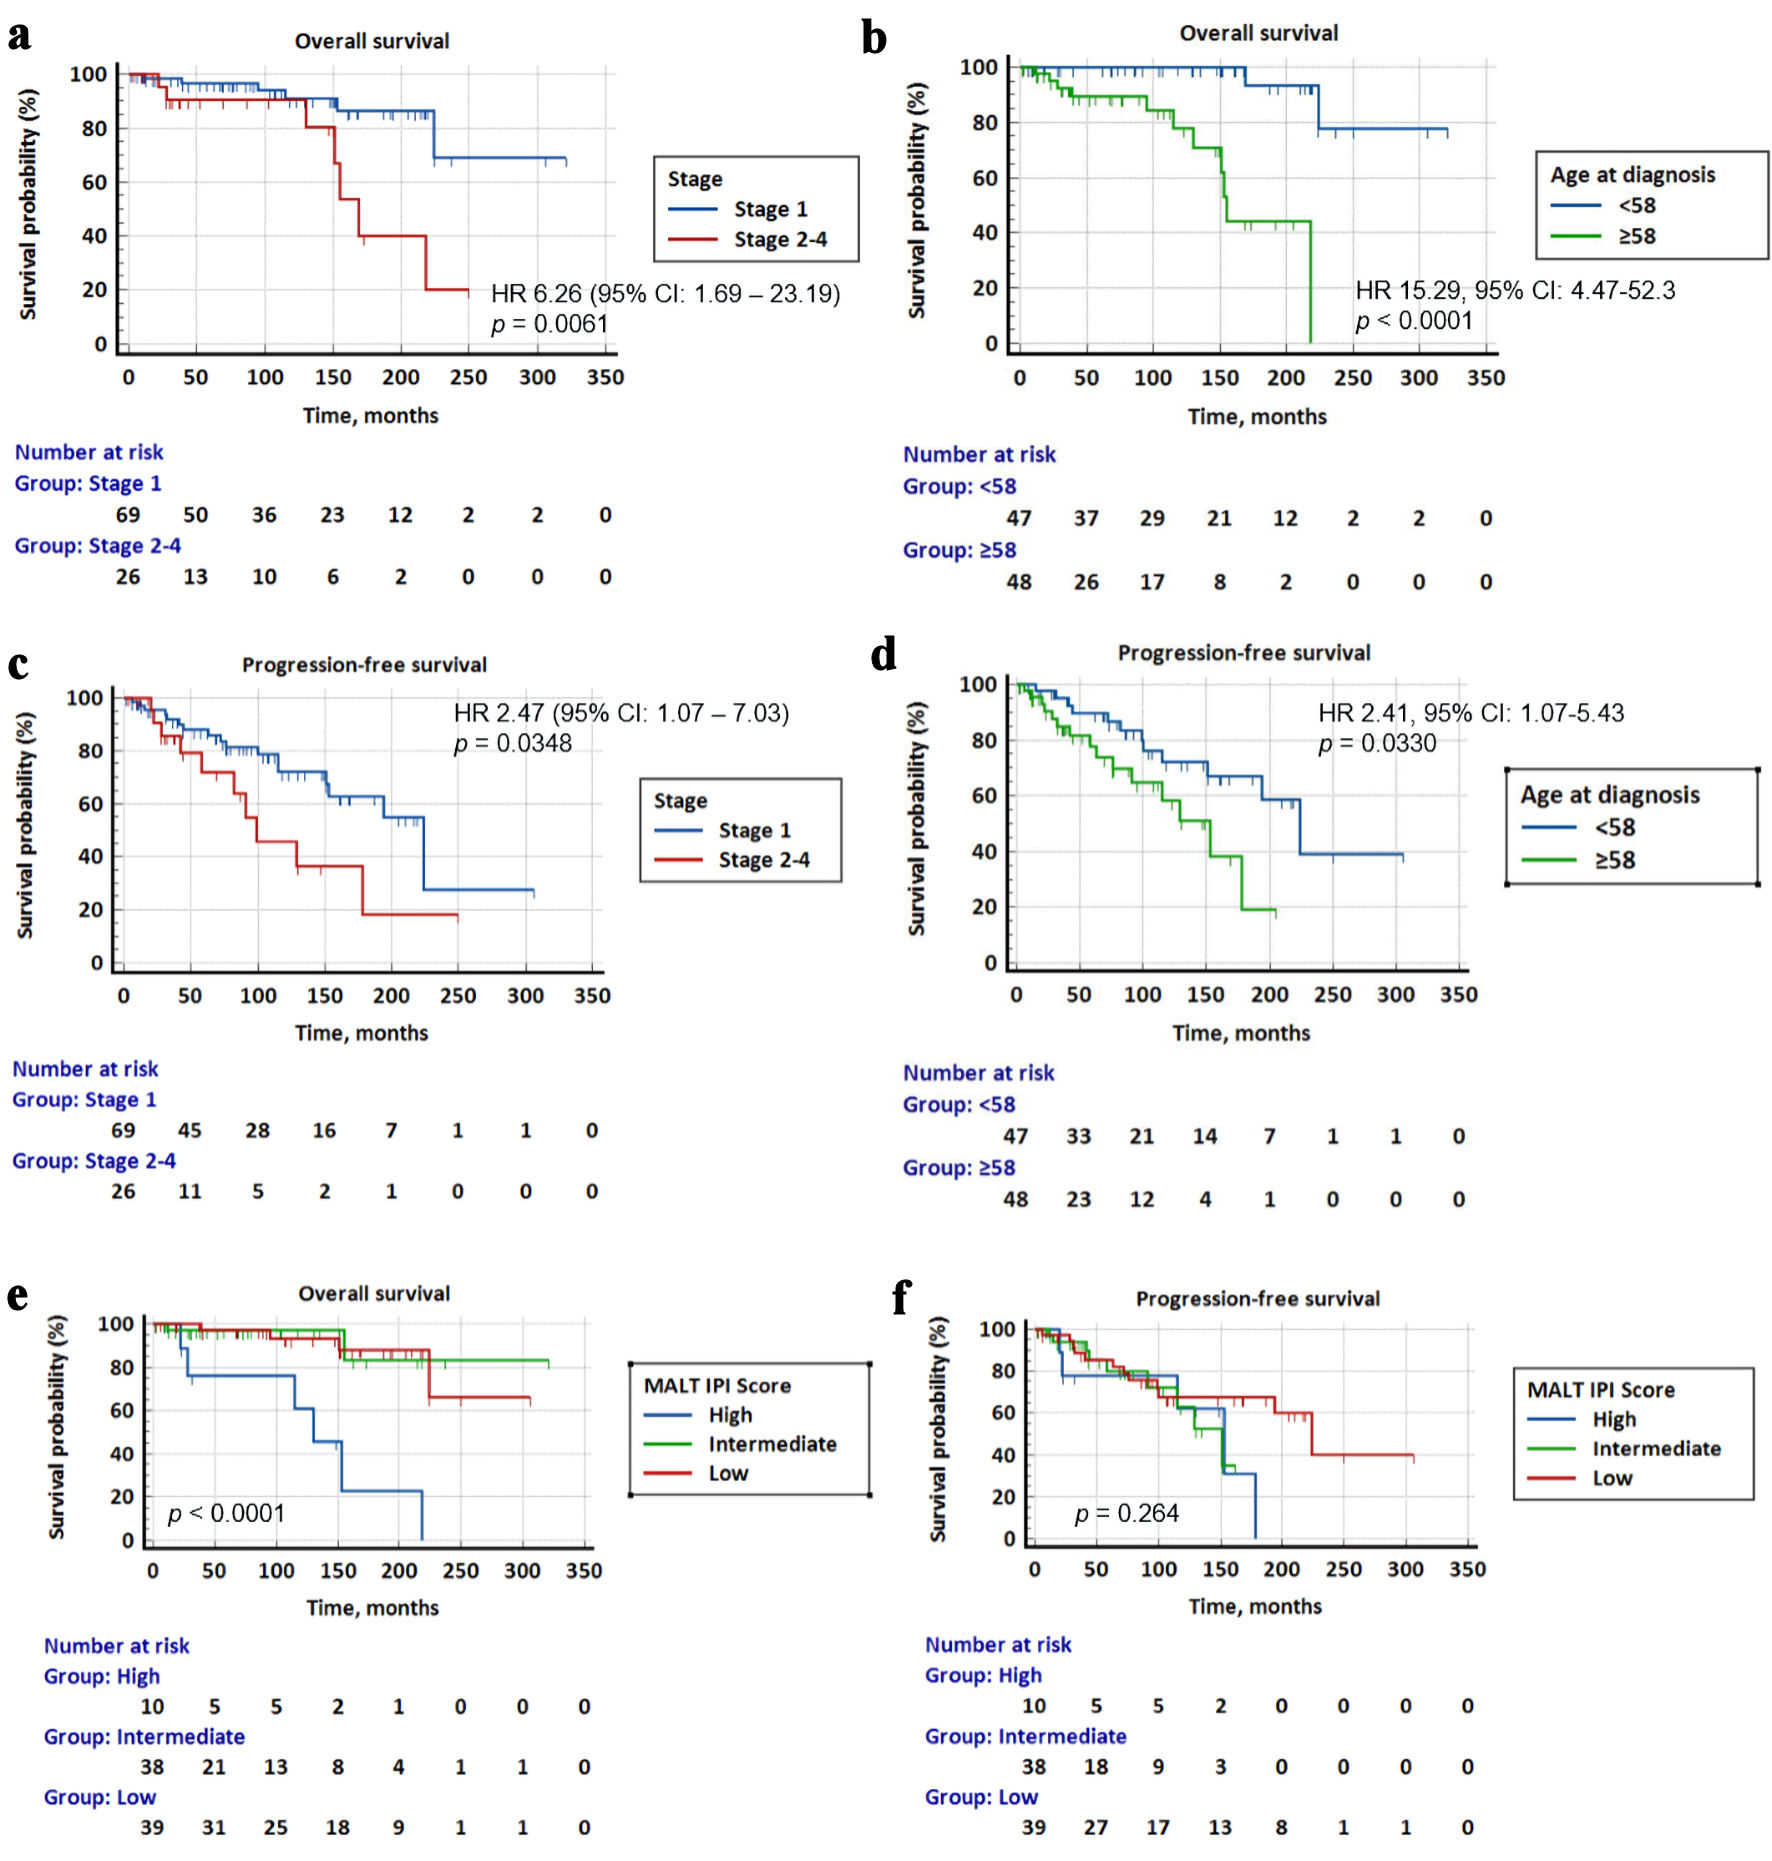
↓ Figure 3. Kaplan-Meier survival curves for
overall survival (OS) and progression-free survival (PFS) stratified by Ann Arbor stage, age at
diagnosis and MALT-IPI score. (a) Patients with stage 2-4 disease had significantly poorer survival than
patients with stage 1 disease (HR = 6.26, 95% CI: 1.69 - 23.19, P = 0.0061). (b) Patients above 58 years
had significantly lower survival than younger patients (HR = 15.29, 95% CI: 4.47 - 52.3, P < 0.0001).
(c) Patients with stage 2-4 disease had a significantly poorer PFS than patients with stage 1 disease
(HR = 2.47, 95% CI: 1.07 - 7.03, P = 0.0348). (d) Patients above 58 years had a significantly lower PFS
than younger patients (HR = 2.41, 95% CI: 1.07 - 5.43, P = 0.0330). (e) OS for low vs. intermediate vs.
high MALT-IPI score. Patients with high MALT-IPI score had significantly worse OS than patients with low
and intermediate IPI scores (HR = 9.28, 95% CI: 1.24 - 69.11, P < 0.0001, and HR = 10.99, 95% CI:
1.34 - 89.94, P < 0.0001) respectively. (f) PFS for low vs. intermediate vs. high MALT-IPI score.
There was no significant difference in PFS of patients with different MALT-IPI scores. MALT-IPI:
mucosa-associated lymphoid tissue International Prognostic Index; HR: hazard ratio; CI: confidence
interval.
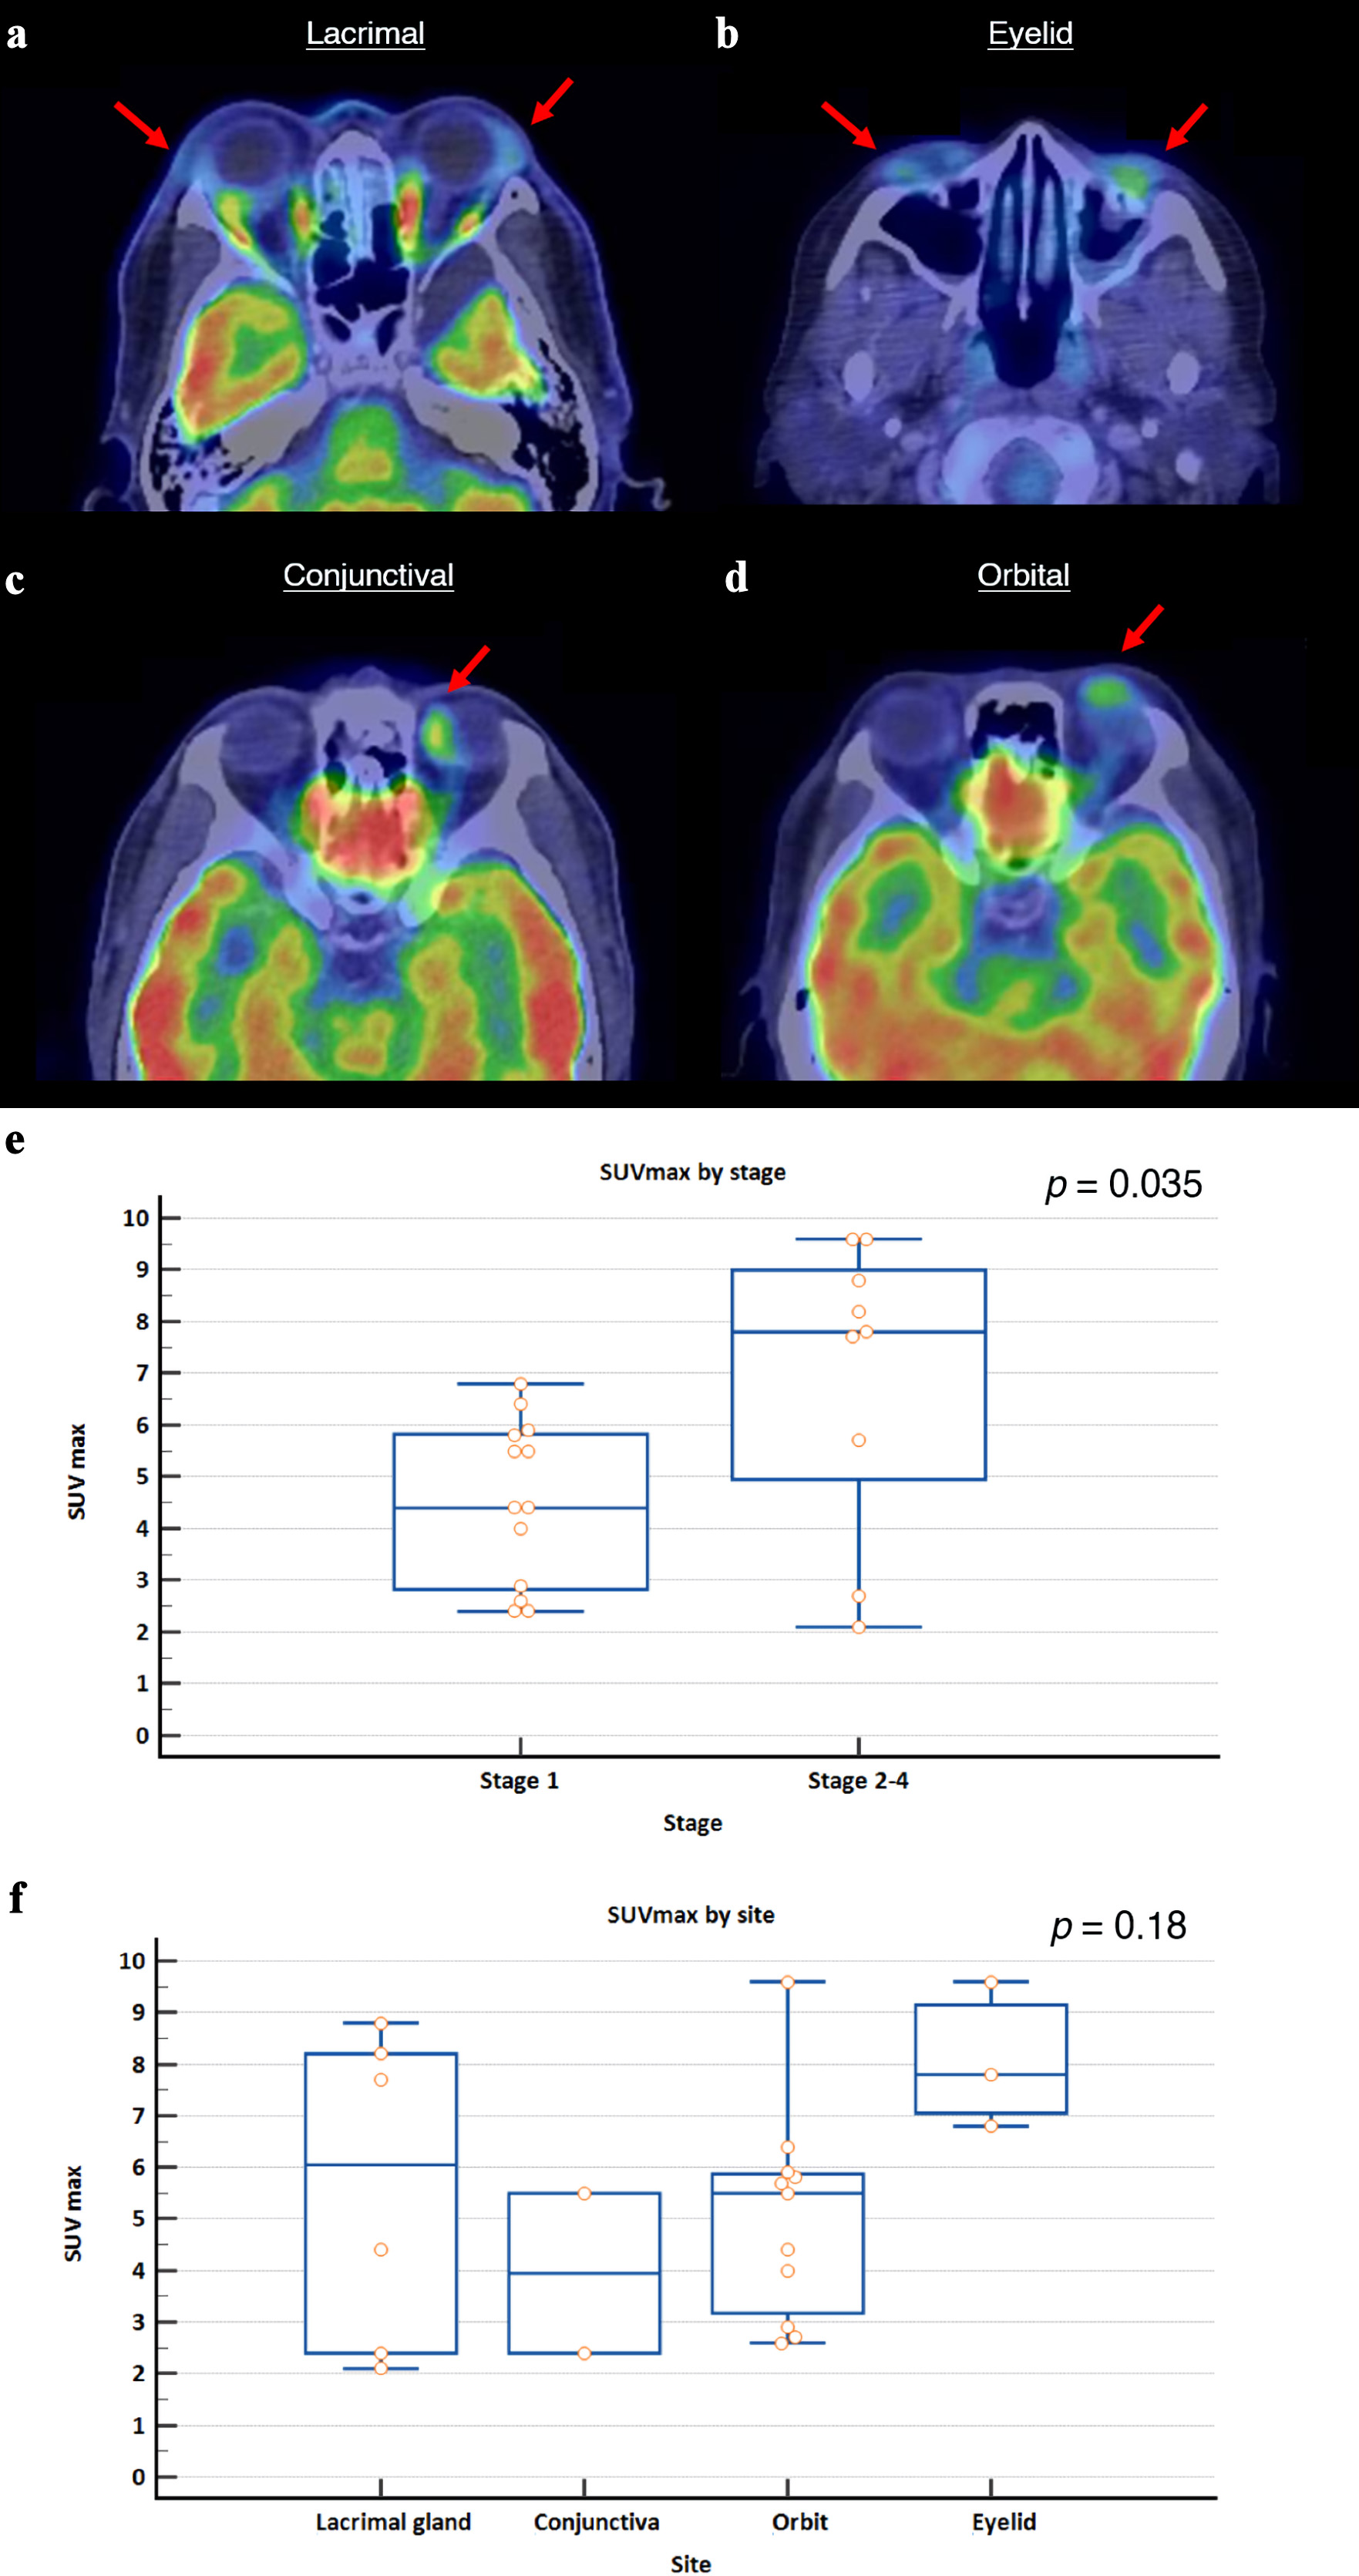
↓ Figure 4. Representative 18-FDG PET/CT images
of ocular marginal zone lymphoma based on anatomical location, and SUVmax values at diagnosis stratified
by Ann Arbor stage and tumor site. (a) Bilateral enlarged and FDG-avid lacrimal glands (left, SUVmax
3.1; right, SUVmax 8.8). (b) Bilateral FDG-avid lower eyelid masses (left, SUVmax 7.8; right, SUVmax
4.0). (c) FDG-avid mass over medial-superior aspect of the left globe (SUVmax 5.5). (d) FDG-avid nodular
lesion on the left orbit (SUVmax 4.4). Red arrows indicate the site of disease. (e) Patients with stage
2-4 disease had significantly higher SUVmax values compared to patients with stage 1 disease (P = 0.035,
Mann-Whitney U test). (f) There was no significant difference between SUVmax values across different
tumor sites, though eyelid tumors had numerically higher uptake values (P = 0.18, Kruskal-Wallis test).
SUVmax: maximum standardized uptake value.
Tables
↓ Table 1. Demographic and Clinical Characteristics of Patients With
OAMZL
|
Characteristics |
N
(%) |
| MALT-IPI: mucosa-associated lymphoid tissue International Prognostic Index; SD: standard
deviation; LDH: lactate dehydrogenase; IgG: immunoglobulin G. |
| Total patients |
95 (100) |
| Sex |
|
| Male |
60 (63.2) |
| Female |
35 (36.8) |
| Age at presentation |
|
| Median (range) |
58 (25 - 88) |
| Mean ± SD |
56.2 ± 14.0 |
| Laterality |
|
| Right |
38 (40.0) |
| Left |
38 (40.0) |
| Bilateral |
19 (20.0) |
| Ethnicity |
|
| Chinese |
76 (80.0) |
| Malay |
10 (10.5) |
| Others |
9 (9.5) |
| Stage at presentation |
|
| I |
69 (72.6) |
| II |
8 (8.4) |
| III |
2 (2.1) |
| IV |
16 (16.8) |
| Location in ocular adnexal region |
|
| Orbit |
47 (49.5) |
| Conjunctiva |
15 (15.8) |
| Lacrimal gland |
22 (23.2) |
| Eyelid |
11 (11.6) |
| Symptoms |
|
| Swelling |
31 (32.6) |
| Mass/lump |
20 (21.1) |
| Proptosis |
18 (18.9) |
| Erythema |
8 (8.4) |
| Ptosis |
8 (8.4) |
| Diplopia |
5 (5.3) |
| Decreased visual acuity |
5 (5.3) |
| Restricted eye movement |
5 (5.3) |
| Pain/discomfort |
4 (4.2) |
| Watery eyes/tearing |
3 (3.2) |
| Not reported |
31 (32.6) |
| Serum LDH status |
|
| Elevated |
27 (28.4) |
| Not elevated |
60 (63.2) |
| Unknown |
8 (8.4) |
| MALT IPI score |
|
| Low (0) |
39 (41.1) |
| Intermediate (1) |
38 (40.0) |
| High (2 - 3) |
10 (10.5) |
| Unknown |
8 (8.4) |
| Known autoimmune disease |
|
| IgG4 disease |
9 (9.5) |
| Sjogren’s syndrome |
2 (2.1) |
| Unspecified connective tissue disease |
1 (1.1) |
| Site of initial disease spread |
|
| Lymph nodes |
|
| Above diaphragm |
14 (14.7) |
| Below diaphragm |
6 (6.3) |
| Unspecified |
2 (2.1) |
| Extranodal sites |
|
| Lung |
3 (3.2) |
| Paravertebral |
3 (3.2) |
| Renal pelvis |
3 (3.2) |
| Stomach |
3 (3.2) |
| Bone marrow |
1 (1.1) |
| Breast |
1 (1.1) |
| Pleura |
1 (1.1) |
| Pericardium |
1 (1.1) |
| Pelvic side wall |
1 (1.1) |
↓ Table 2. First-Line Management of Patients With Ocular Lymphoma in the
Study Cohort
|
Stage |
Management strategy |
N
(%) |
| aOther chemotherapy: CP (chlorambucil, prednisone) (n = 2), R-CP (rituximab,
chlorambucil, prednisone) (n = 1), R-CHOP (rituximab, cyclophosphamide, doxorubicin, vincristine,
prednisone) (n = 1). R-CVP: rituximab, cyclophosphamide, vincristine, prednisone. |
| 1 (n = 69) |
Radiation therapy alone |
61 (64.2) |
|
Rituximab alone |
1 (1.1) |
|
Rituximab + bendamustine |
1 (1.1) |
|
Excision alone |
2 (2.1) |
|
Watchful waiting |
4 (4.2) |
| 2-4 (n = 26) |
Radiation therapy alone |
11 (11.6) |
|
Rituximab alone |
3 (3.2) |
|
R-CVP |
4 (4.2) |
|
Other chemotherapya |
4 (4.2) |
|
Watchful waiting |
4 (4.2) |