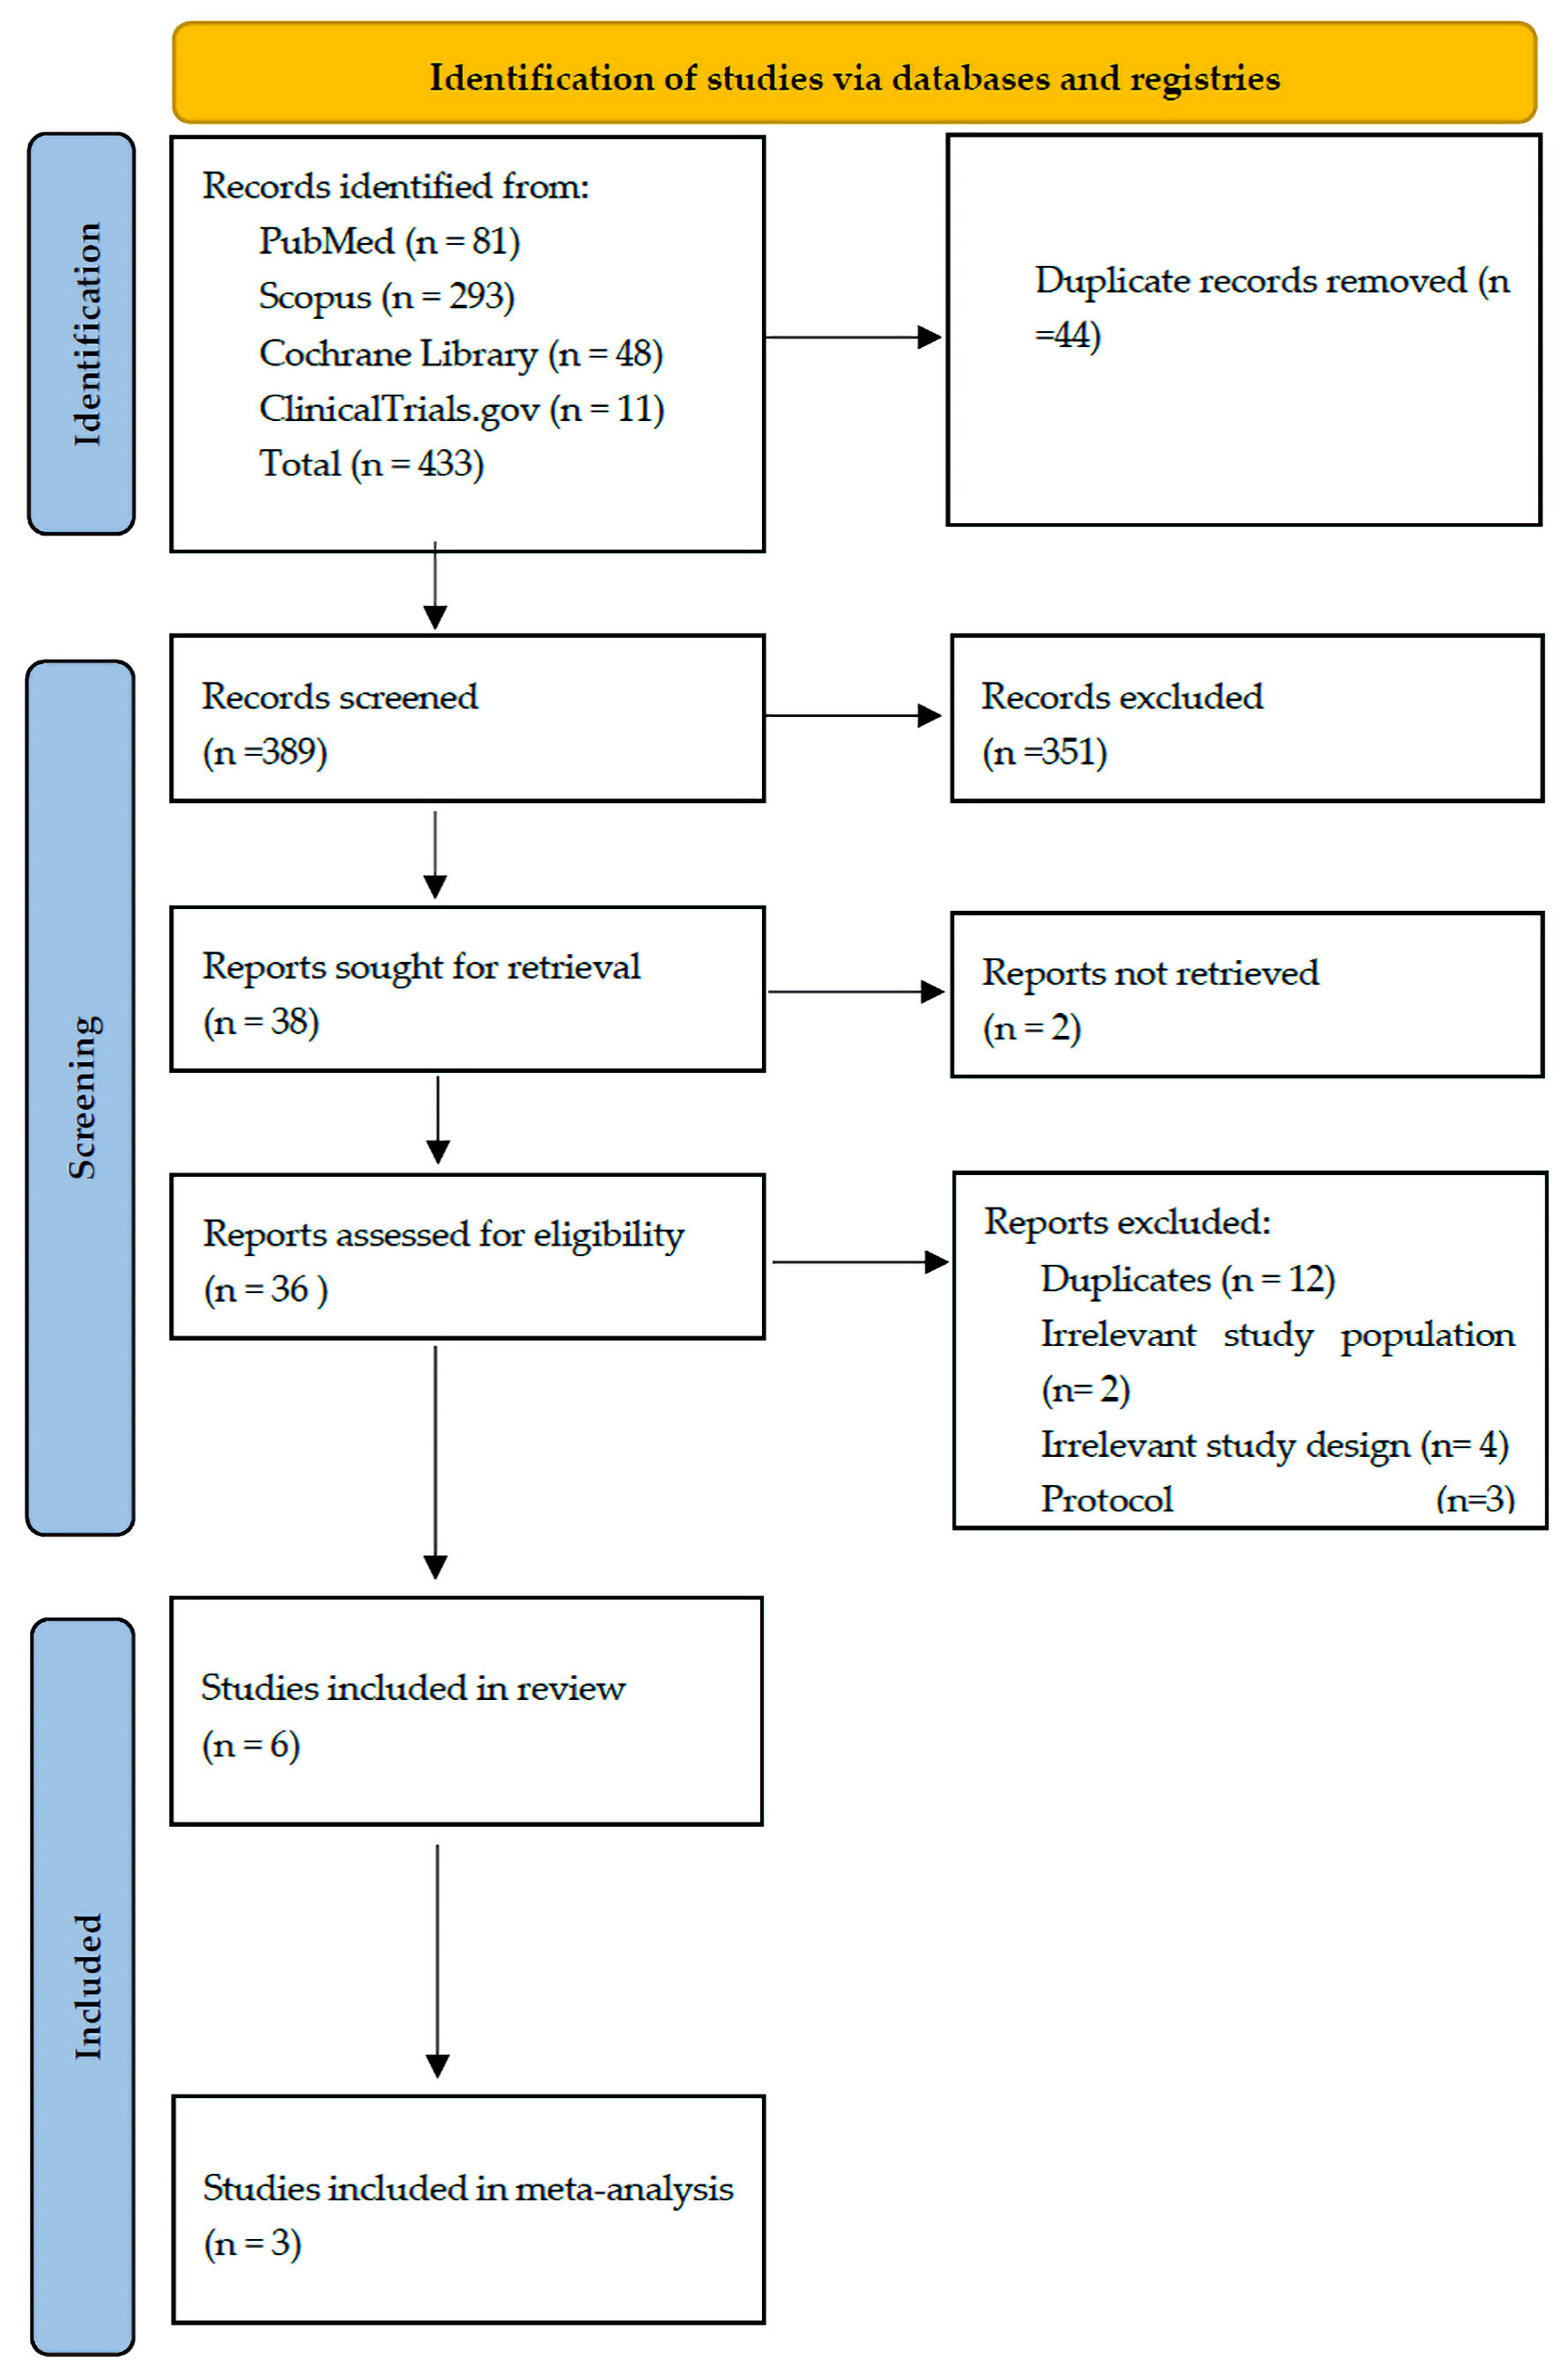
Figure 1. PRISMA chart of the reported studies showing the search selection strategy and exclusion criteria. PRISMA: Preferred Reporting Items for Systematic Reviews and Meta-Analyses.
| Journal of Hematology, ISSN 1927-1212 print, 1927-1220 online, Open Access |
| Article copyright, the authors; Journal compilation copyright, J Hematol and Elmer Press Inc |
| Journal website https://jh.elmerpub.com |
Original Article
Volume 14, Number 4, August 2025, pages 214-222
Efficacy and Safety of Momelotinib in Myelofibrosis: A Systematic Review and Meta-Analysis With a Focus on Anemia Outcomes
Figures


