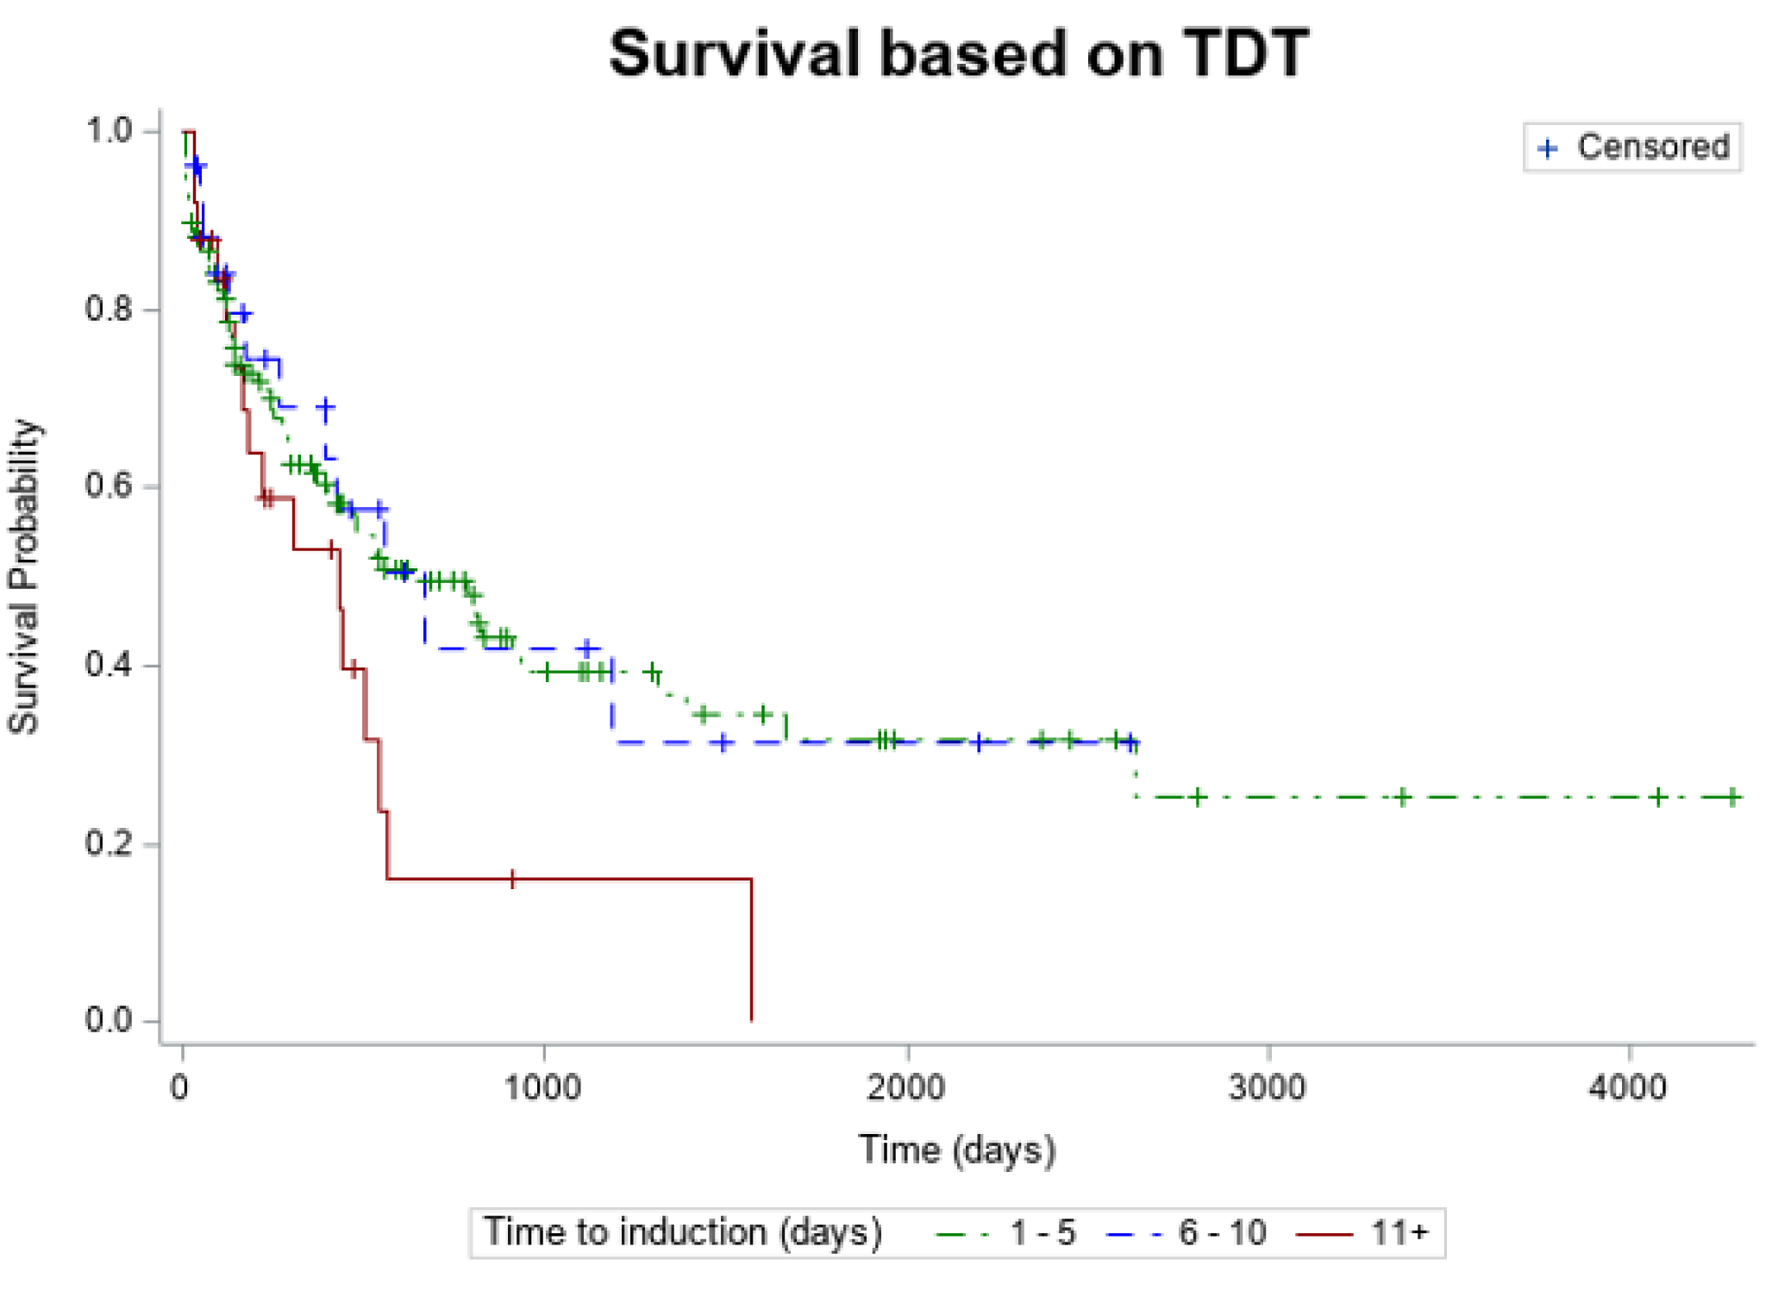
↓ Figure 1. Kaplan-Meier estimates of overall
survival according TDT. TDT: timing from diagnosis to treatment.
| Journal of Hematology, ISSN 1927-1212 print, 1927-1220 online, Open Access |
| Article copyright, the authors; Journal compilation copyright, J Hematol and Elmer Press Inc |
| Journal website https://jh.elmerpub.com |
Original Article
Volume 14, Number 4, August 2025, pages 202-209
Does Time Matter From Diagnosis to Induction in Acute Myeloid Leukemia?
Figures
Tables
| Characteristics | 1 to 5 days (n = 130) | 6 to 10 days (n = 30) | 11+ days (n = 27) | P-values | Total |
|---|---|---|---|---|---|
| *Statistical significance (P < 0.05). AML: acute myeloid leukemia; ANC: absolute neutrophil count; ELN: European LeukemiaNet; Hb: hemoglobin; NS: not statistically significant; SD: standard deviation; TDT: timing from diagnosis to treatment; WBC: white blood cell. | |||||
| Age (years), mean (SD) | 61.9 (16.3) | 63.3 (15.0) | 71.2 (11.3) | ||
| Age (years), n (%) | |||||
| Under 60 years | 53 (40.8%) | 9 (30.0%) | 2 (7.4%) | < 0.05* | 64 |
| 60+ years | 77 (59.2%) | 21 (70.0%) | 25 (92.6%) | 123 | |
| Sex, n (%) | |||||
| Male | 63 (48.5%) | 15 (50.0%) | 16 (59.3%) | NS | 94 |
| Female | 67 (51.5%) | 15 (50.0%) | 11 (40.7%) | 93 | |
| Race, n (%) | |||||
| White | 106 (92.2%) | 24 (88.9%) | 24 (88.9%) | NS | 154 |
| Black | 4 (3.5%) | 2 (7.4%) | 1 (3.7%) | 7 | |
| Asian | 2 (1.7%) | 0 (0%) | 0 (0%) | 2 | |
| Other | 3 (2.6%) | 1 (3.7%) | 2 (7.4%) | 6 | |
| Lab parameters at diagnosis, median (range) | |||||
| WBC (× 103/µL) | 20.2 (0.4 - 397.8) | 4.4 (0.5 - 98.4) | 3.3 (0.4 - 800.0) | NS | |
| ANC (µL) | 1125 (0 - 51,700) | 380 (0 - 5,490) | 600 (1 - 7,230) | ||
| Hb (g/dL) | 8.3 (3.4 - 14.8) | 8.7 (4.4 - 13.8) | 8.1 (5.3 - 13.7) | ||
| Platelets (× 103/µL) | 56 (5 - 367) | 52 (5 - 633) | 69 (16 - 538) | ||
| Peripheral blood blast (%) | 38.0% (0 - 99.0) | 5.5% (0 - 92.5) | 4.5% (0 - 86) | ||
| Bone marrow blasts (%) | 56.4% (0 - 99.0) | 31.4% (1.5 - 96.2) | 30.2% (7.0 - 80.0) | ||
| WBC > 50 (× 103/µL) | 43 | 5 | 2 | ||
| ELN 2022 risk stratification | |||||
| Favorable | 28 (22.8%) | 6 (20.7%) | 3 (11.5%) | 0.305 | 37 |
| Intermediate | 50 (40.7%) | 8 (27.6%) | 9 (34.6%) | 67 | |
| Adverse | 45 (36.6%) | 15 (51.7%) | 14 (53.9%) | 74 | |
| Secondary AML status | |||||
| De novo | 96 (71.6%) | 22 (16.4%) | 16 (11.9%) | 134 | |
| Mutations at diagnosis | NS | ||||
| CBF | 6 (4.8%) | 4 (13.3%) | 1 (4.0%) | 11 | |
| NPM1 | 49 (38.0%) | 6 (20.0%) | 3 (11.1%) | 58 | |
| CEBPA | 9 (7.0%) | 3 (10.0%) | 1 (3.7%) | 13 | |
| FLT3-ITD | 34 (26.4%) | 2 (6.7%) | 1 (3.7%) | 37 | |
| FLT3-TKI | 4 (3.1%) | 1 (3.3%) | 1 (3.7%) | 6 | |
| KMT2A | 2 (1.6%) | 0 (0%) | 0 (0%) | 2 | |
| TP53 | 7 (5.4%) | 4 (13.3%) | 4 (15.4%) | 15 | |
| Time to induction | Mean (SD) |
|---|---|
| SD: standard deviation. | |
| 1 to 5 days (n = 130) | 20.5 (26.6) |
| 6 to 10 days (n = 30) | 18.0 (21.4) |
| 11+ days (n = 27) | 10.4 (11.2) |
| Time to induction | HR | 95% CI |
|---|---|---|
| CI: confidence interval; HR: hazard ratio. | ||
| 1 to 5 days vs. 11+ days | 0.567 | 0.325 - 0.989 |
| 1 to 5 days vs. 6 to 10 days | 1.072 | 0.577 - 1.992 |
| 11+ days vs. 6 to 10 days | 1.780 | 0.839 - 3.773 |
| Reasons for delay | n = 27 (%) |
|---|---|
| NGS: next-generation sequencing. | |
| Waiting for NGS/molecular results | 11 (41%) |
| Active infection or hemodynamic instability | 7 (26%) |
| Waiting for patient’s decision regarding treatment | 7 (26%) |
| No clear reason identified | 2 (7%) |
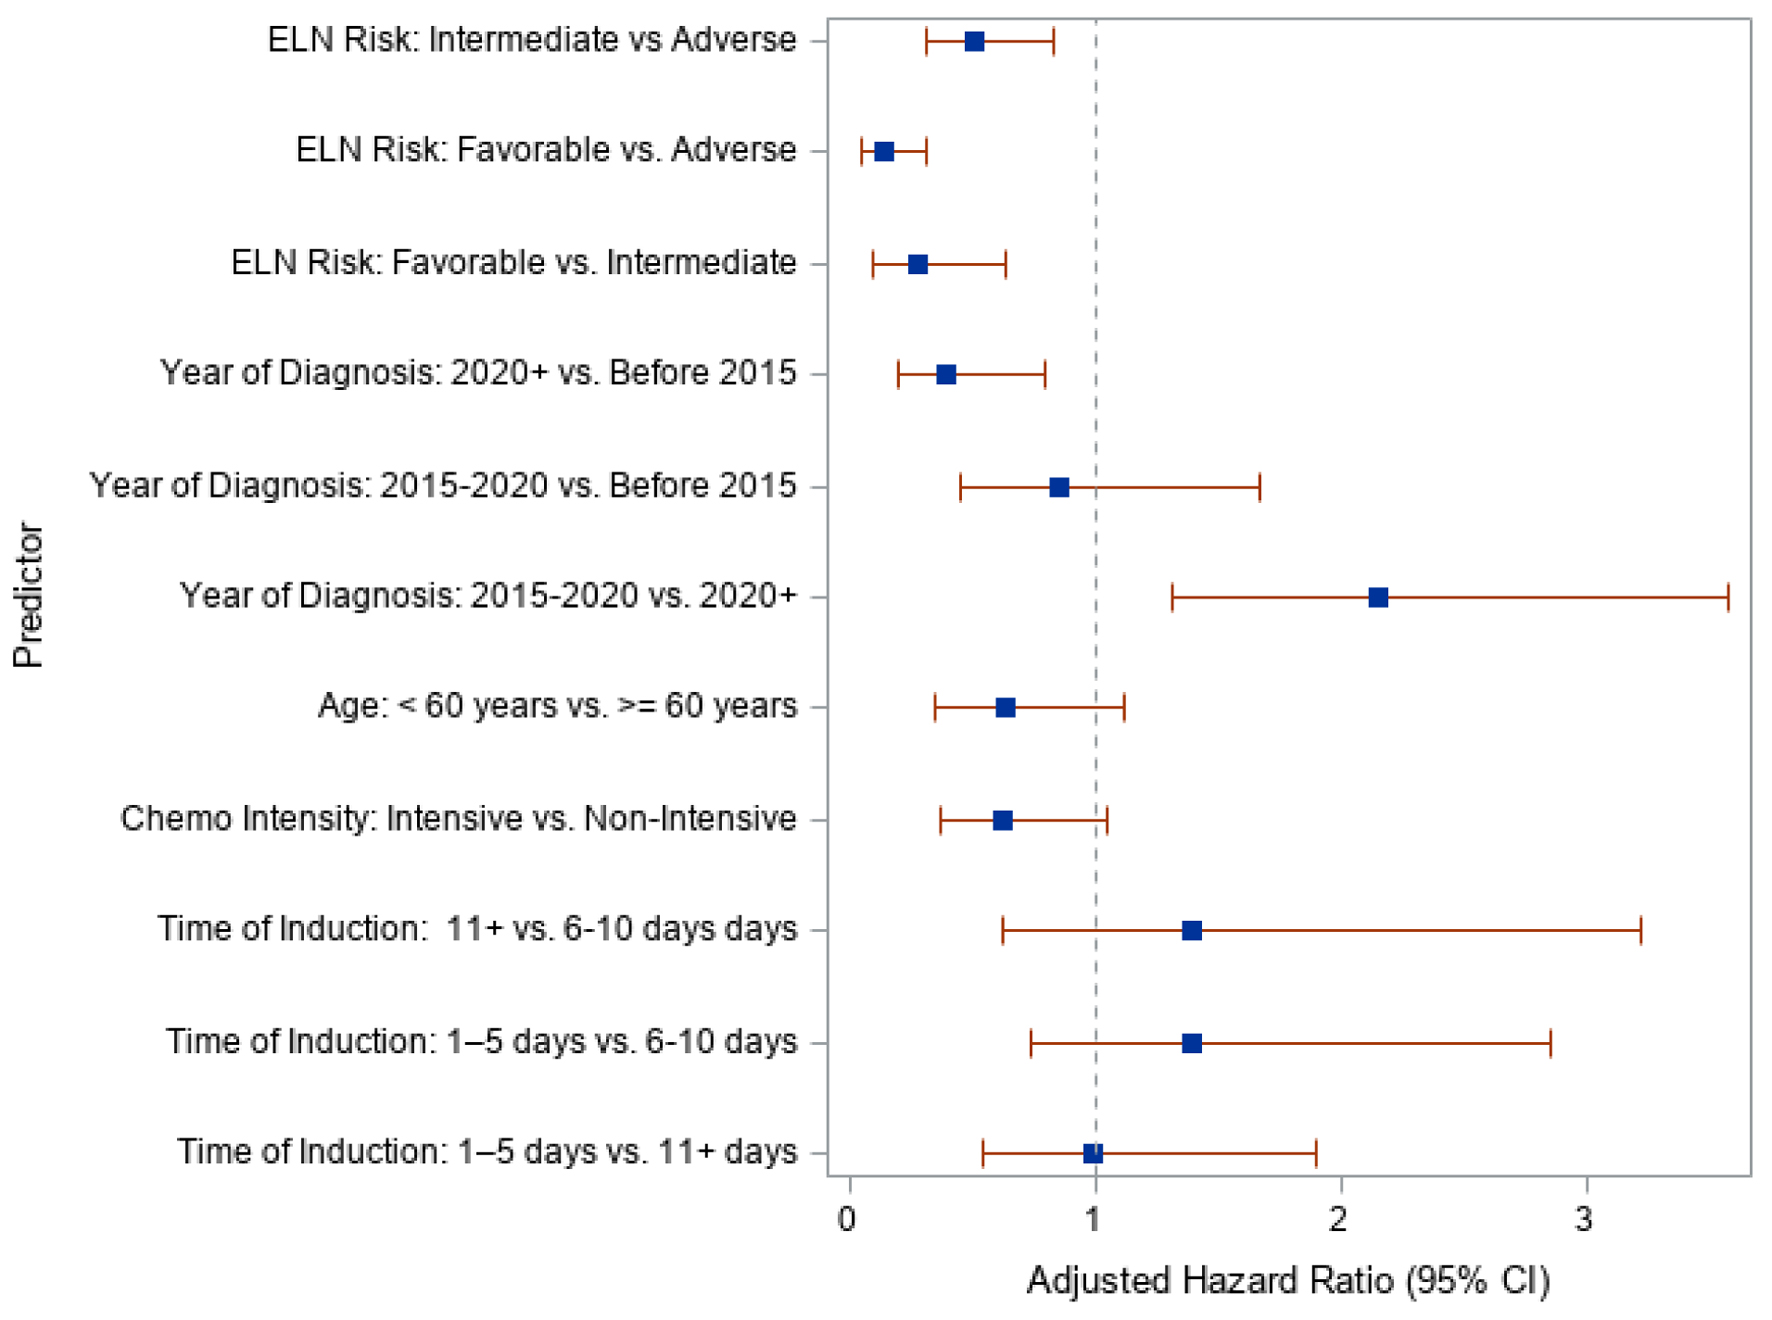
| Predictors | aHR | 95% CI |
|---|---|---|
| aHR: adjusted hazard ratio; CI: confidence interval; ELN: European LeukemiaNet. | ||
| Time to induction | ||
| 11+ days vs. 6 - 10 days | 1.398 | 0.624 - 3.223 |
| 1 - 5 days vs. 6 - 10 days | 1.390 | 0.740 - 2.853 |
| 1 - 5 days vs. 11+ days | 0.994 | 0.546 - 1.904 |
| Chemotherapy intensity | ||
| Intensive vs. non-intensive | 0.627 | 0.370 - 1.056 |
| Age | ||
| < 60 years vs. ≥ 60 years | 0.634 | 0.347 - 1.124 |
| Year of diagnosis | ||
| 2020 forward vs. before 2015 | 0.395 | 0.203 - 0.802 |
| 2015 to 2020 vs. before 2015 | 0.852 | 0.455 - 1.674 |
| 2015 to 2020 vs. 2020 forward | 2.157 | 1.311 - 3.575 |
| ELN status | ||
| Intermediate vs. adverse | 0.514 | 0.314 - 0.829 |
| Favorable vs. adverse | 0.144 | 0.054 - 0.319 |
| Favorable vs. intermediate | 0.279 | 0.103 - 0.642 |
| Early death | 1 to 5 days | 6 to 10 days | 11+ days | Total |
|---|---|---|---|---|
| AML: acute myeloid leukemia. | ||||
| Death after 90 days | 43 (66.2%) | 9 (13.9%) | 13 (20.0%) | 65 |
| Death within 30 days | 13 (100%) | 0 (0%) | 0 (0%) | 13 |
| Death within 90 days | 6 (50.0%) | 3 (25.0%) | 3 (25.0%) | 12 |
| Characteristics | 1 to 5 days (n = 130) | 6 to 10 days (n = 30) | 11+ days (n = 27) | P-valuesa | Total |
|---|---|---|---|---|---|
| *Statistical significance (P < 0.05). aFisher’s exact test was used for platelet recovery days due to low sample size. SD: standard deviation; TDT: timing from diagnosis to treatment. | |||||
| Time to best response (days), mean (SD) | 35.3 (10.5) | 35.5 (10.2) | 34.3 (11.4) | ||
| Chemotherapy intensity, n (%) | |||||
| Non-intensive | 38 (29.2%) | 14 (46.7%) | 19 (70.4%) | P < 0.05* | 71 |
| Intensive | 92 (70.8%) | 16 (53.3%) | 8 (29.6%) | 116 | |
| Remission status, n (%) | |||||
| Complete remission | 90 (72.6%) | 21 (75.0%) | 10 (45.5%) | P < 0.05* | 121 |
| No response | 34 (27.4%) | 7 (25.0%) | 12 (54.6%) | 53 | |
| Platelet recovery (days), mean (SD) | 27.4 (20.9) | 25.3 (10.1) | 27.4 (23.3) | ||
| Platelet recovery, n (%) | |||||
| 1 to 28 days | 84 (67.2%) | 18 (64.3%) | 11 (50.0%) | 0.481a | 113 |
| 29+ days | 24 (19.2%) | 6 (21.4%) | 5 (22.73%) | 35 | |
| No recovery | 17 (13.6%) | 4 (14.3%) | 6 (27.3%) | 27 | |
| Neutrophil recovery (days), mean (SD) | 30.8 (14.6) | 29.7 (10.5) | 26.7 (14.1) | ||
| Neutrophil recovery | |||||
| No recovery | 22 (18.2%) | 4 (14.3%) | 6 (33.3%) | 0.242 | 32 |
| Recovery | 99 (81.8%) | 24 (85.7%) | 12 (66.7%) | 135 | |
| Transplant | |||||
| No transplant | 59 (63.4%) | 19 (20.4%) | 15 (16.1%) | No transplant | |
| Allogeneic stem cell transplant | 40 (75%) | 7 (13%) | 6 (11%) | Allogeneic stem cell transplant | |