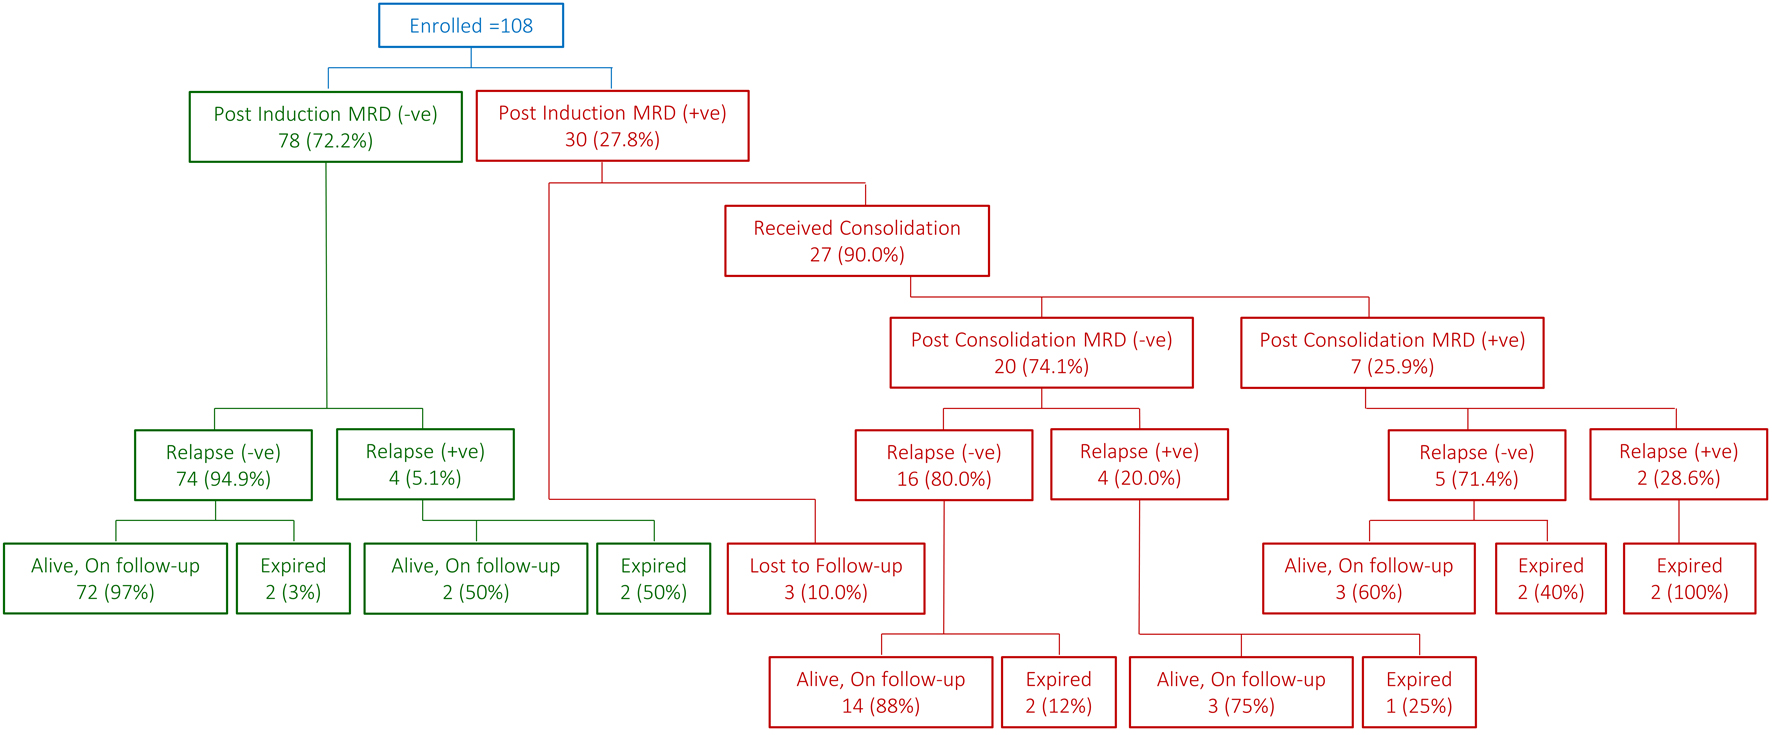
↓ Figure 1. Snapshot of patient flow.
| Journal of Hematology, ISSN 1927-1212 print, 1927-1220 online, Open Access |
| Article copyright, the authors; Journal compilation copyright, J Hematol and Elmer Press Inc |
| Journal website https://jh.elmerpub.com |
Original Article
Volume 14, Number 2, April 2025, pages 56-65
Post-Induction Minimal Residual Disease in Pediatric Pre-B-Cell Acute Lymphoblastic Leukemia: A Step Towards Precision Medicine?
Figures
Tables
| Parameters of interest | At induction (n = 108) | Post-consolidation (n = 27) |
|---|---|---|
| CNS: central nervous system; WBC: white blood cell. | ||
| Gender | ||
| Male | 52 (48.1%) | 13 (48.1%) |
| Female | 56 (51.9%) | 14 (51.9%) |
| Age at diagnosis (years), median (range) | 4.3 (1.1 - 13.9) | 4.0 (1.5 - 13.9) |
| ≤ 10 years | 91 (84.3%) | 22 (81.5%) |
| > 10 years | 17 (15.7%) | 5 (18.5%) |
| WBC at presentation (× 109/L) | 11.6 (1.0 - 395.8) | 16 (1.1 - 395.8) |
| < 50 × 109/L | 88 (81.5%) | 20 (74.1%) |
| 50 - 100 × 109/L | 10 (9.3%) | 3 (11.1%) |
| > 100 × 109/L | 10 (9.3%) | 4 (14.8%) |
| CNS status | ||
| CNS-1 | 91 (84.3%) | 24 (88.9%) |
| CNS-2 | 13 (12.0%) | 2 (7.4%) |
| CNS-3 | 4 (3.7%) | 1 (3.7%) |
| Risk stratification | ||
| Standard risk | 66 (61.1%) | 14 (51.9%) |
| High risk | 42 (38.9%) | 13 (48.1%) |
| Treatment protocols | ||
| AALL0232 | 44 (40.7%) | 14 (51.9%) |
| AALL0331 | 64 (59.3%) | 13 (48.1%) |
| Testicular disease (+) | 1 (1.9%) | None |
| Molecular/cytogenetic | ||
| Favorable | 92/100 (92.0%) | 23 (85.2%) |
| Unfavorable | 8/100 (8.0%) | 4 (14.8%) |
| Parameters of interest | MRD (-) | MRD (+) | Total | P-value |
|---|---|---|---|---|
| CNS: central nervous system; MRD: minimal residual disease; WBC: white blood cell. | ||||
| Gender | 0.527 | |||
| Male | 36 (46.2%) | 16 (53.3%) | 52 (48.1%) | |
| Female | 42 (53.8%) | 14 (46.7%) | 56 (51.9%) | |
| Age at diagnosis (years), median (range) | 4.3 (1.1 - 13.3) | 4.0 (1.5 - 13.9) | 4.3 (1.1 - 13.9) | 0.959 |
| ≤ 10 years | 66 (84.6%) | 25 (83.3%) | 91 (84.3%) | 1.000 |
| > 10 years | 12 (15.4%) | 5 (16.7%) | 17 (15.7%) | |
| WBC at presentation (× 109/L) | 10.6 (1.0 - 200.0) | 14.4 (1.0 - 395.8) | 11.6 (1.0 - 395.8) | 0.387 |
| < 50 × 109/L | 65 (83.3%) | 23 (76.7%) | 88 (81.5%) | 0.607 |
| 50 - 100 × 109/L | 7 (9.0%) | 3 (10.0%) | 10 (9.3%) | |
| > 100 × 109/L | 6 (7.7%) | 4 (13.3%) | 10 (9.3%) | |
| CNS status | 0.721 | |||
| CNS-1 | 64 (82.1%) | 27 (90.0%) | 91 (84.3%) | |
| CNS-2 | 11 (14.1%) | 2 (6.7%) | 13 (12.0%) | |
| CNS-3 | 3 (3.8%) | 1 (3.3%) | 4 (3.7%) | |
| Risk stratification | 0.660 | |||
| Standard risk | 49 (62.8%) | 17 (56.7%) | 66 (61.1%) | |
| High risk | 29 (37.2%) | 13 (43.3%) | 42 (38.9%) | |
| Treatment protocols | 0.514 | |||
| AALL0232 | 30 (38.5%) | 14 (46.7%) | 44 (40.7%) | |
| AALL0331 | 48 (61.5%) | 16 (53.3%) | 64 (59.3%) | |
| Molecular/cytogenetic studies | 0.236 | |||
| Favorable | 66 (94.3%) | 26 (86.7%) | 92 (92.0%) | |
| Unfavorable | 4 (5.7%) | 4 (13.3%) | 8 (8.0%) | |
| Parameters of interest | MRD (-) | MRD (+) | Total | P-value |
|---|---|---|---|---|
| CNS: central nervous system; MRD: minimal residual disease; WBC: white blood cell. | ||||
| Gender | 0.209 | |||
| Male | 8 (40.0%) | 5 (71.4%) | 13 (48.1%) | |
| Female | 12 (60.0%) | 2 (28.6%) | 14 (51.9%) | |
| Age at diagnosis (years), median (range) | 3.9 (1.5 - 13.9) | 4.0 (2.1 - 11.0) | 4.0 (1.5 - 13.9) | 0.766 |
| ≤ 10 years | 16 (80.0%) | 6 (85.7%) | 22 (81.5%) | 1.000 |
| > 10 years | 4 (20.0%) | 1 (14.3%) | 5 (18.5%) | |
| WBC at presentation (× 109/L) | 12.6 (1.1 - 331.3) | 43.9 (3.0 - 395.8) | 16.0 (1.1 - 395.8) | 0.179 |
| < 50 × 109/L | 16 (80.0%) | 4 (57.1%) | 20 (74.1%) | 0.195 |
| 50 - 100 × 109/L | 1 (5.0%) | 2 (28.6%) | 3 (11.1%) | |
| > 100 × 109/L | 3 (15.0%) | 1 (14.3%) | 4 (14.8%) | |
| CNS status | 0.156 | |||
| CNS-1 | 19 (95.0%) | 5 (71.4%) | 24 (88.9%) | |
| CNS-2 | 1 (5.0%) | 1 (14.3%) | 2 (7.4%) | |
| CNS-3 | None | 1 (14.3%) | 1 (3.7%) | |
| Risk stratification | 0.678 | |||
| Standard risk | 11 (55.0%) | 3 (42.9%) | 14 (51.9%) | |
| High risk | 9 (45.0%) | 4 (57.1%) | 13 (48.1%) | |
| Treatment protocols | 0.385 | |||
| AALL0232 | 9 (45.0%) | 5 (71.4%) | 14 (51.9%) | |
| AALL0331 | 11 (55.0%) | 2 (28.6%) | 13 (48.1%) | |
| Post-induction treatment protocols | 0.269 | |||
| High risk | 18 (90.0%) | 5 (71.4%) | 23 (85.2%) | |
| Very high risk | 1 (5.0%) | 1 (14.3%) | 2 (7.4%) | |
| Salvage therapy | 1 (5.0%) | 1 (14.3%) | 2 (7.4%) | |
| Molecular/cytogenetic studies | 1.000 | |||
| Favorable | 17 (85.0%) | 6 (85.7%) | 23 (85.2%) | |
| Unfavorable | 3 (15.0%) | 1 (14.3%) | 4 (14.8%) | |
| Chronology of relapse | n (%) | Time to relapse (months from diagnosis) |
|---|---|---|
| CNS: central nervous system; MRD: minimal residual disease. | ||
| Post-induction MRD (-) | 16.1 (4.7 - 45.1) | |
| Bone marrow | 2/78 (2.6%) | |
| Bone marrow + CNS | 1/78 (1.3%) | |
| CNS | 1/78 (1.3%) | |
| Post-induction MRD (+) | ||
| Post-consolidation MRD (-) | 51.4 (15.3 - 76.3) | |
| Bone marrow | 3/20 (15.0%) | |
| Bone marrow + CNS | 1/20 (5.0%) | |
| Post-consolidation MRD (+) | 9.8 (7.7 - 11.9) | |
| Bone marrow | 1/7 (14.3%) | |
| CNS | 1/7 (14.3%) | |
| Post-induction | Total (n = 108) | P-value | Post-consolidation | Total (n = 27) | P-value | |||
|---|---|---|---|---|---|---|---|---|
| MRD (-) (n = 78) | MRD (+) (n = 30) | MRD (-) (n = 20) | MRD (+) (n = 7) | |||||
| MRD: minimal residual disease. | ||||||||
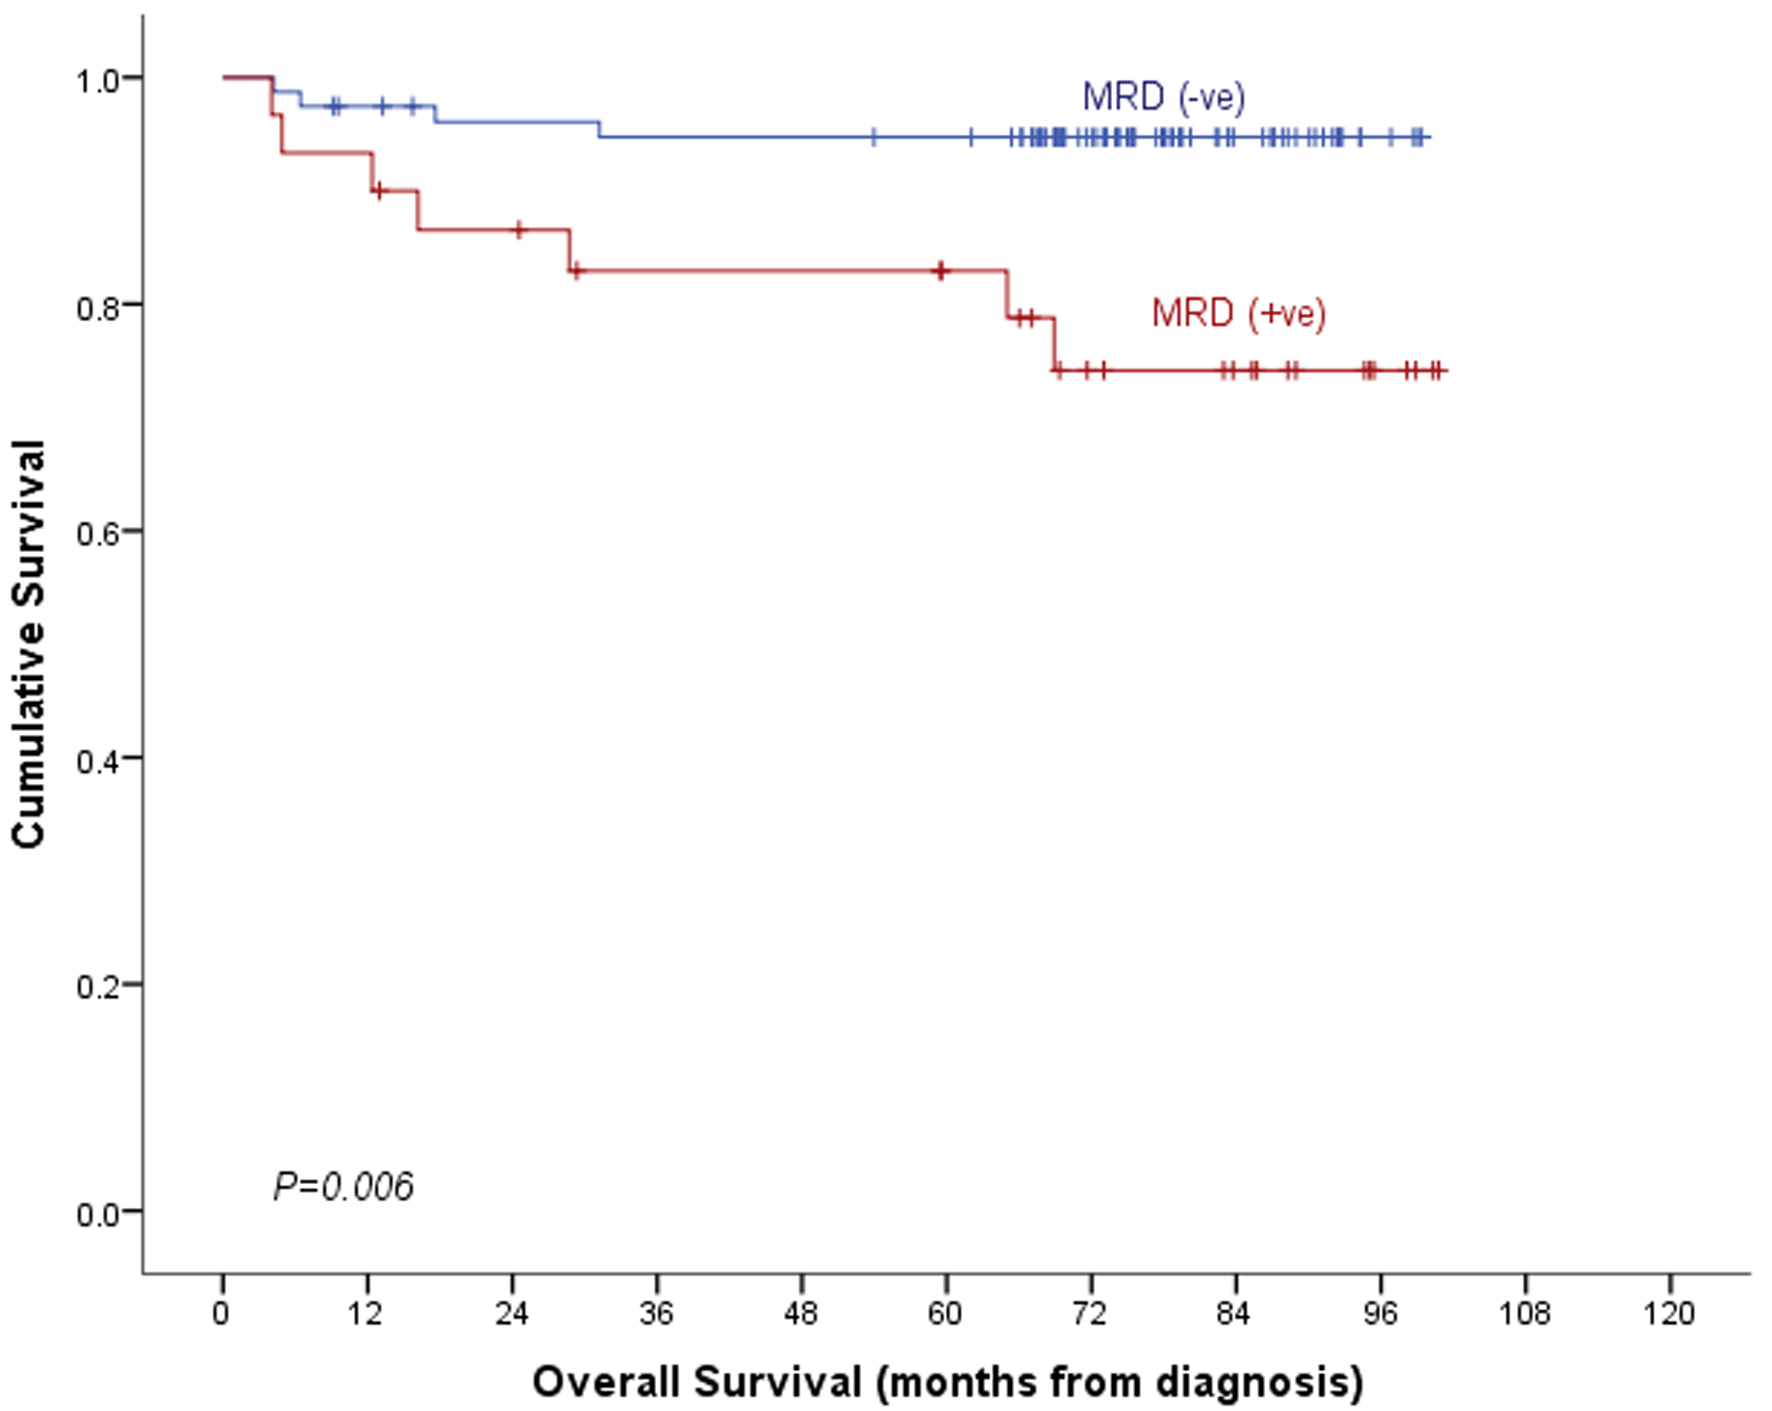
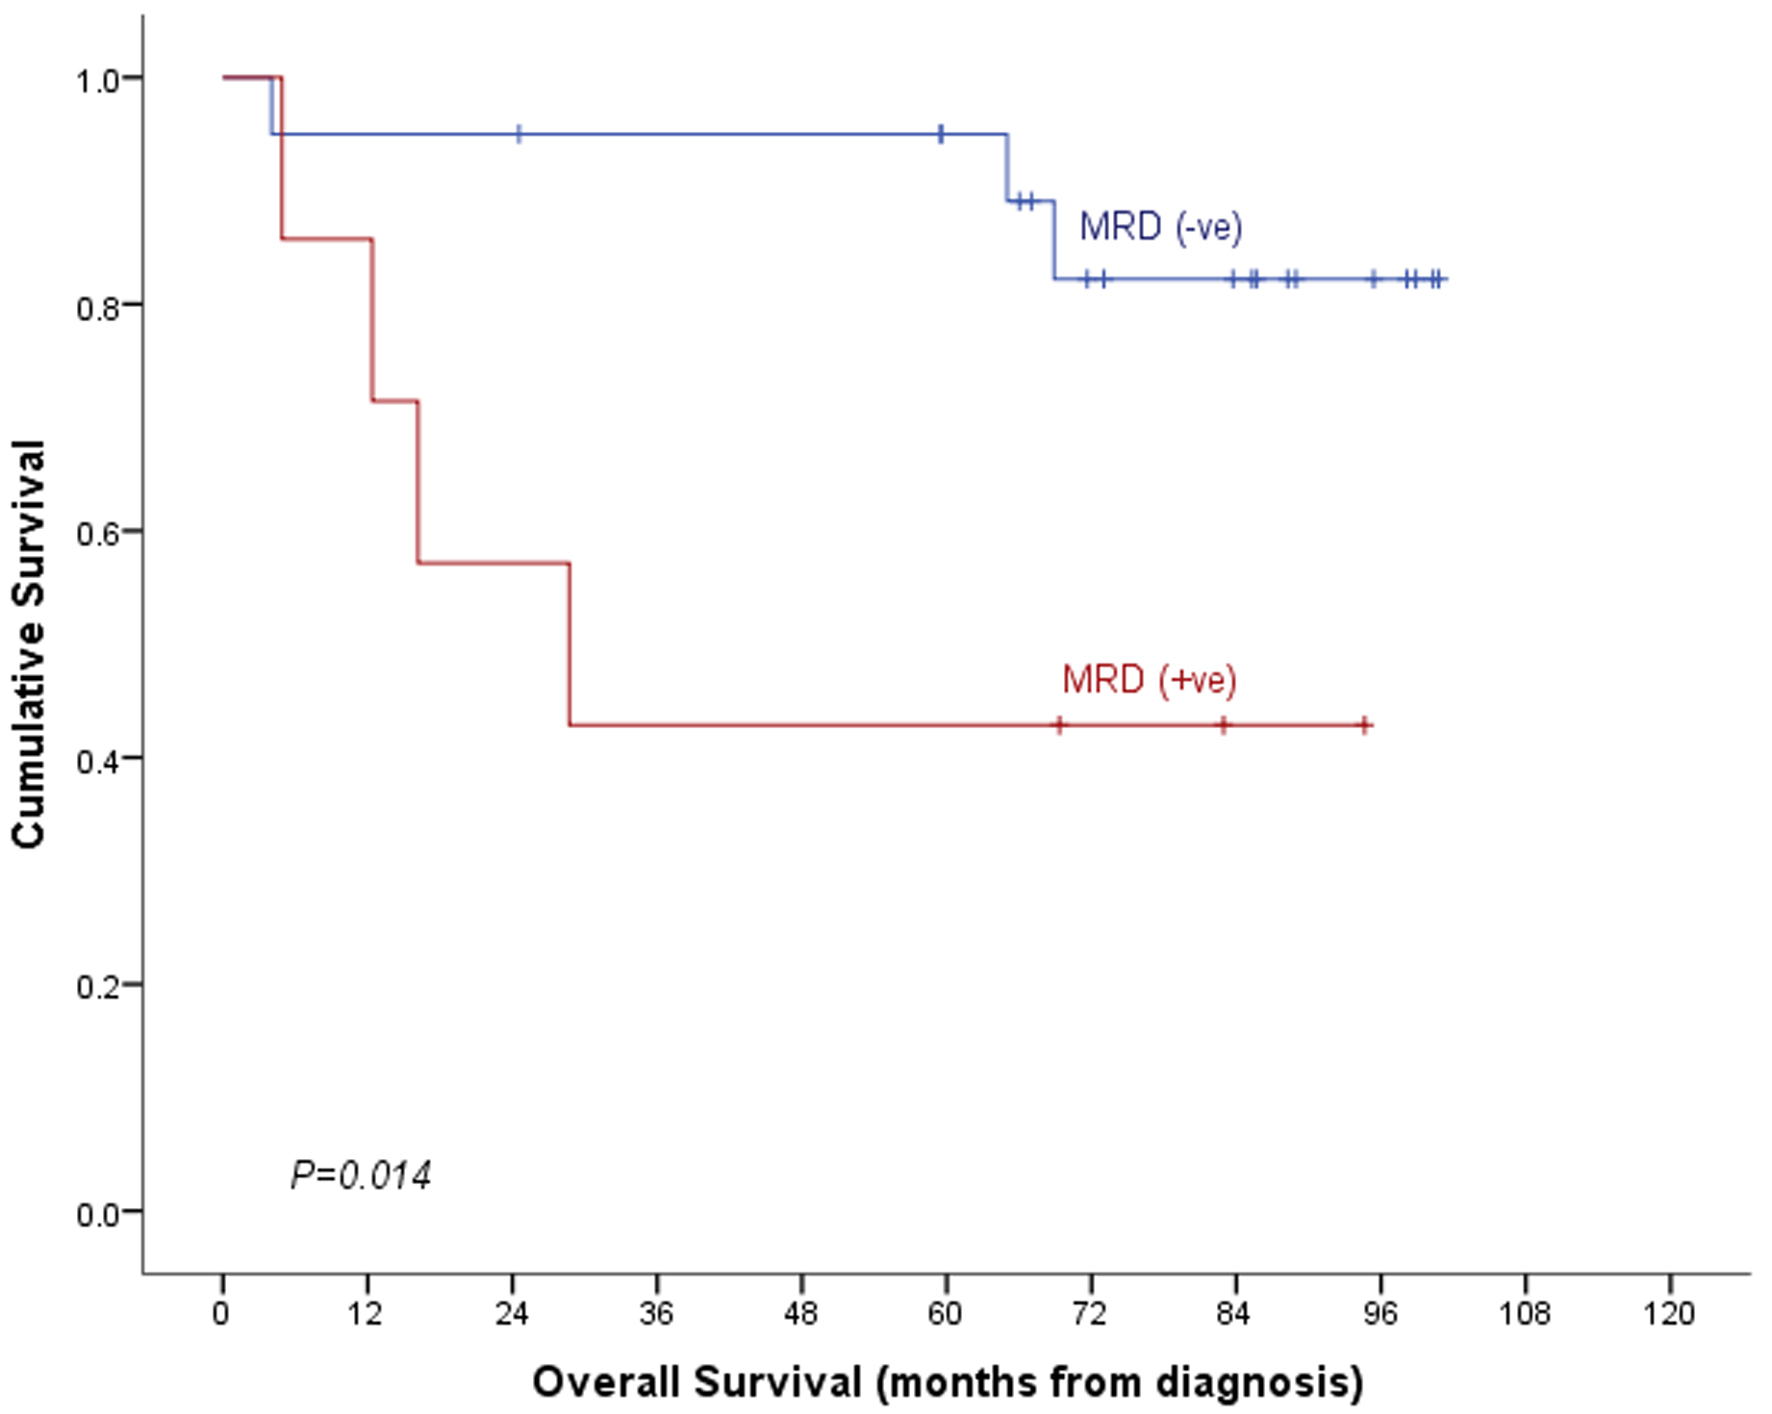
| Mortality rate | 4 (5.1%) | 7 (23.3%) | 11 (10.2%) | - | 3 (15.0%) | 4 (57.1%) | 7 (25.9%) | - |
| Overall survival | 94.7±2.6% | 74.2±8.6% | 89.2±3.1% | 0.006 | 82.2±9.4% | 42.9±18.7% | 72.2±9.0% | 0.014 |
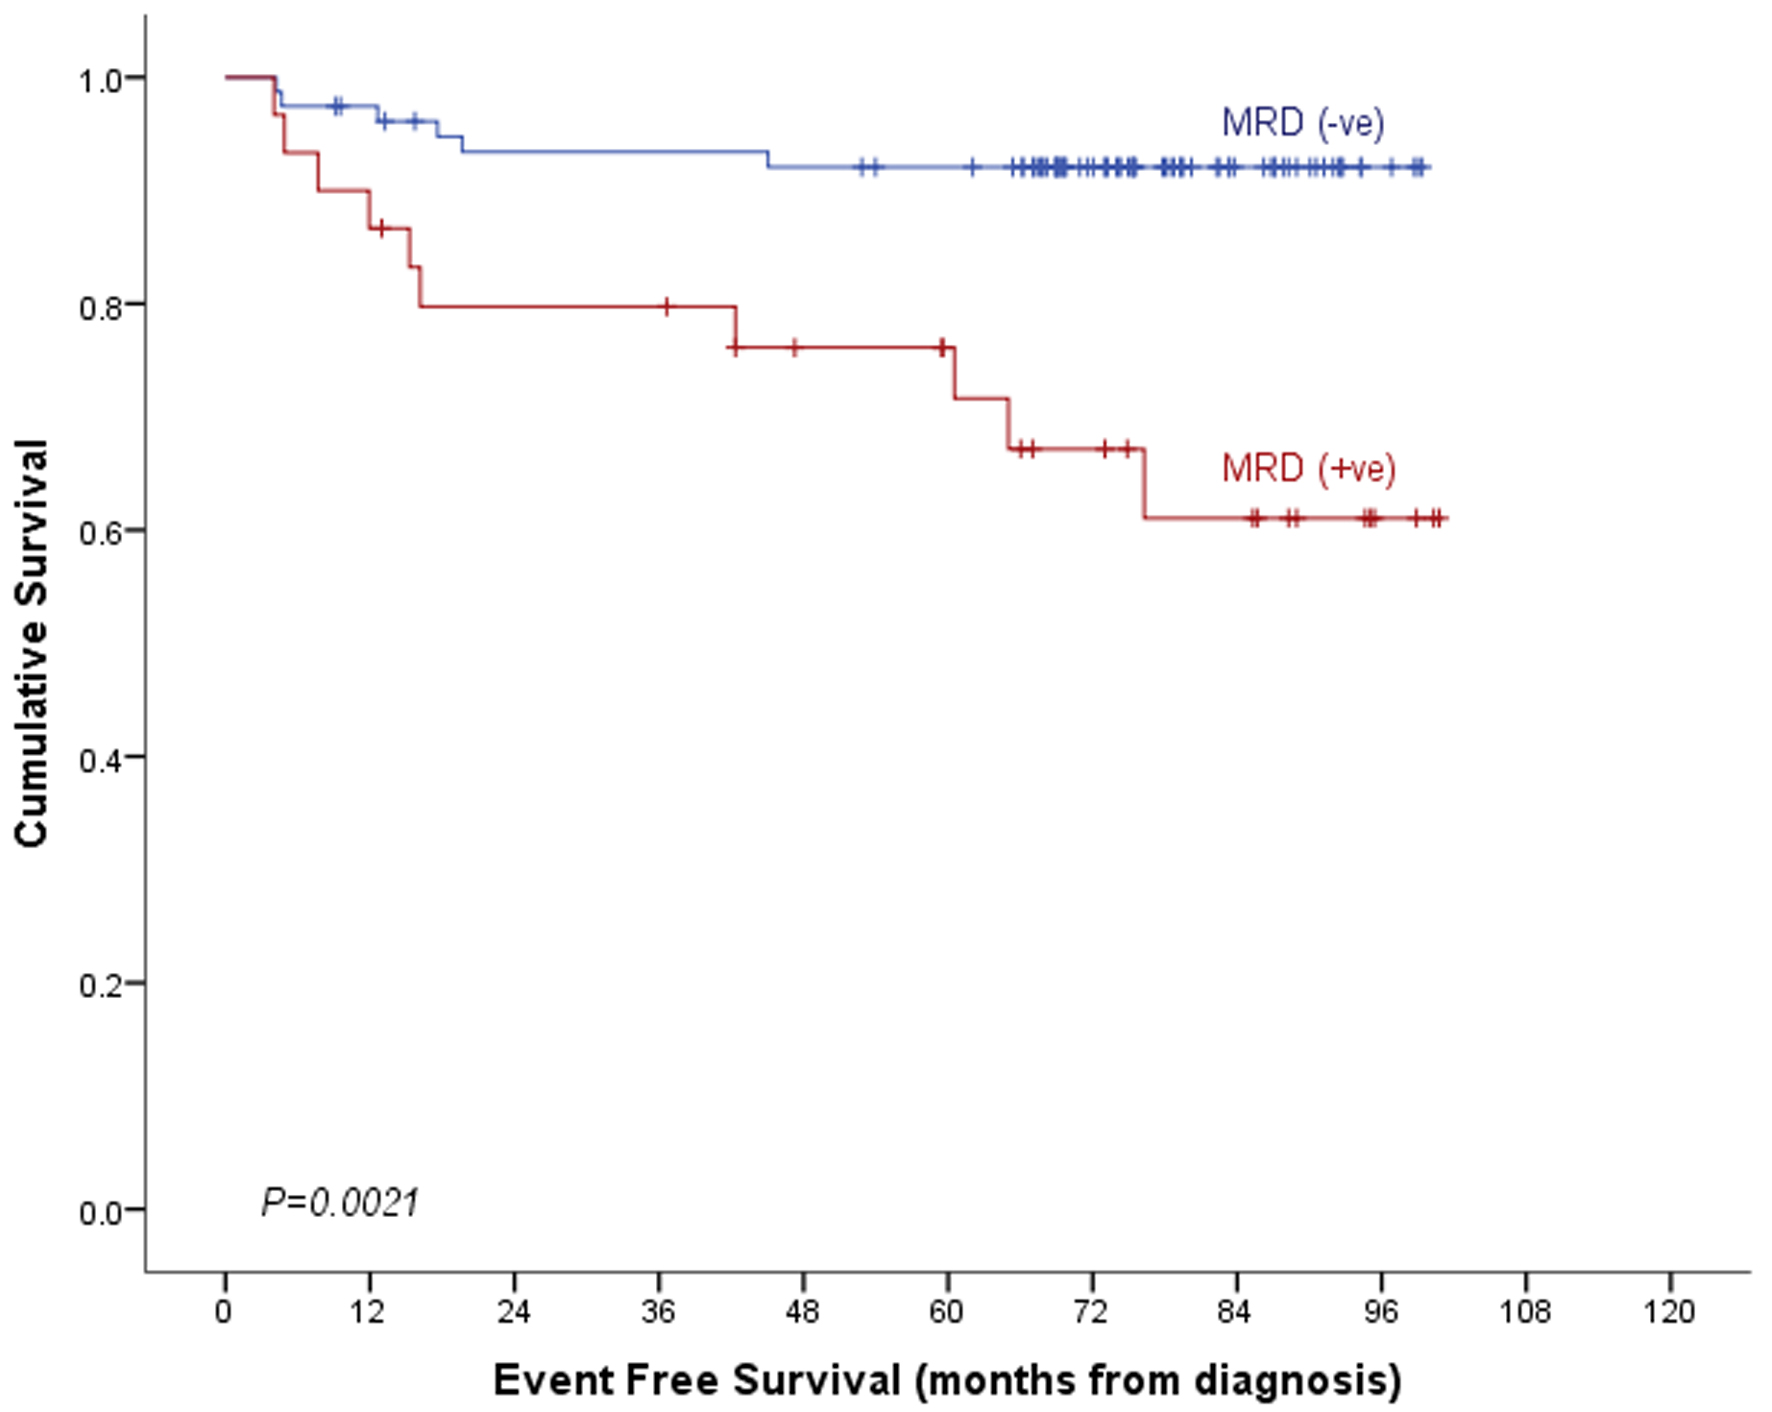
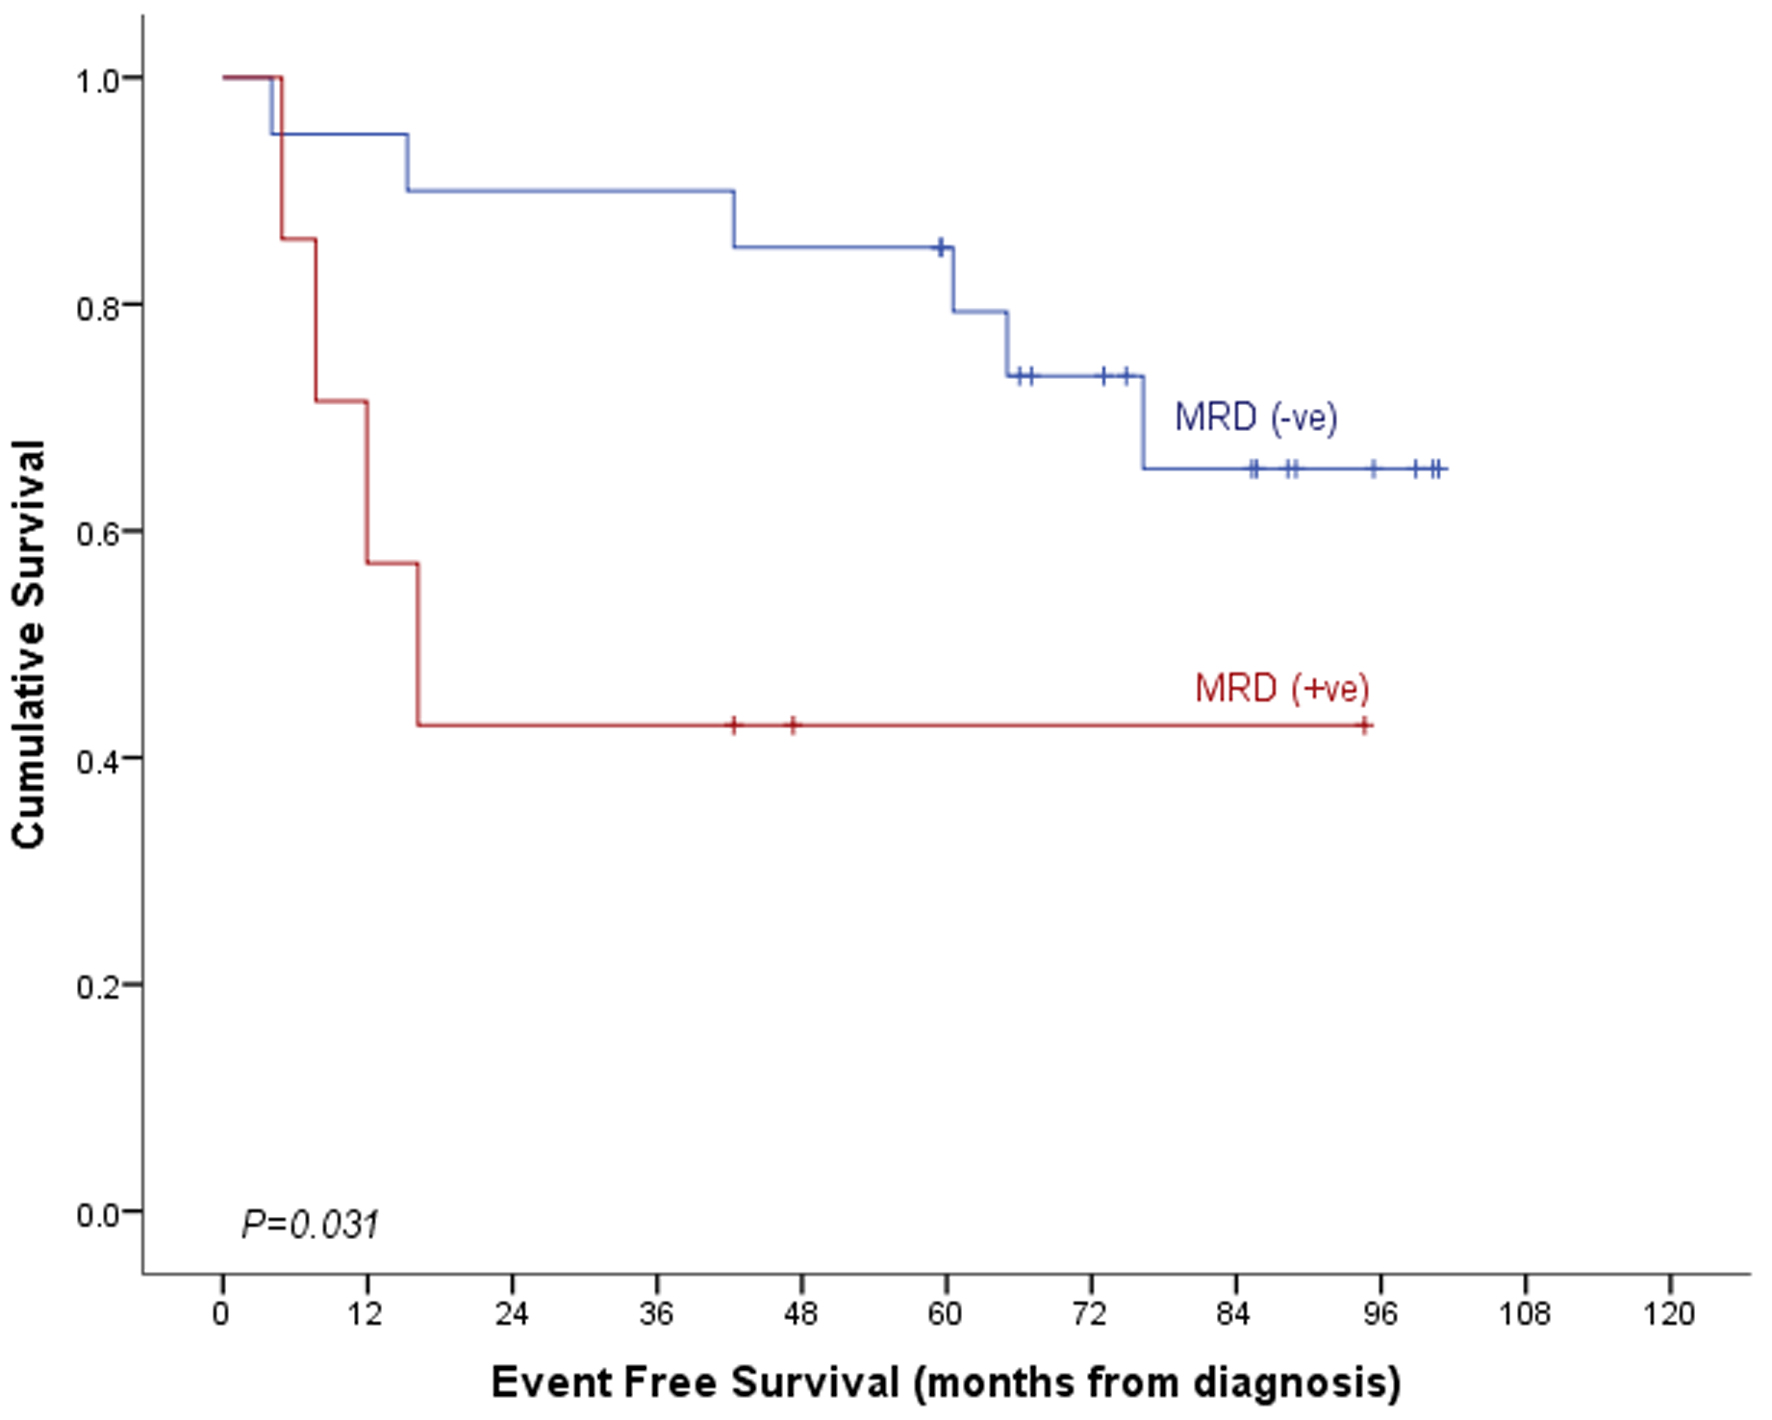
| Event-free survival | 92.1±3.1% | 61.1±10.2% | 83.5±3.9% | 0.001 | 65.5±11.9% | 42.9±18.7% | 58.3±10.6% | 0.031 |