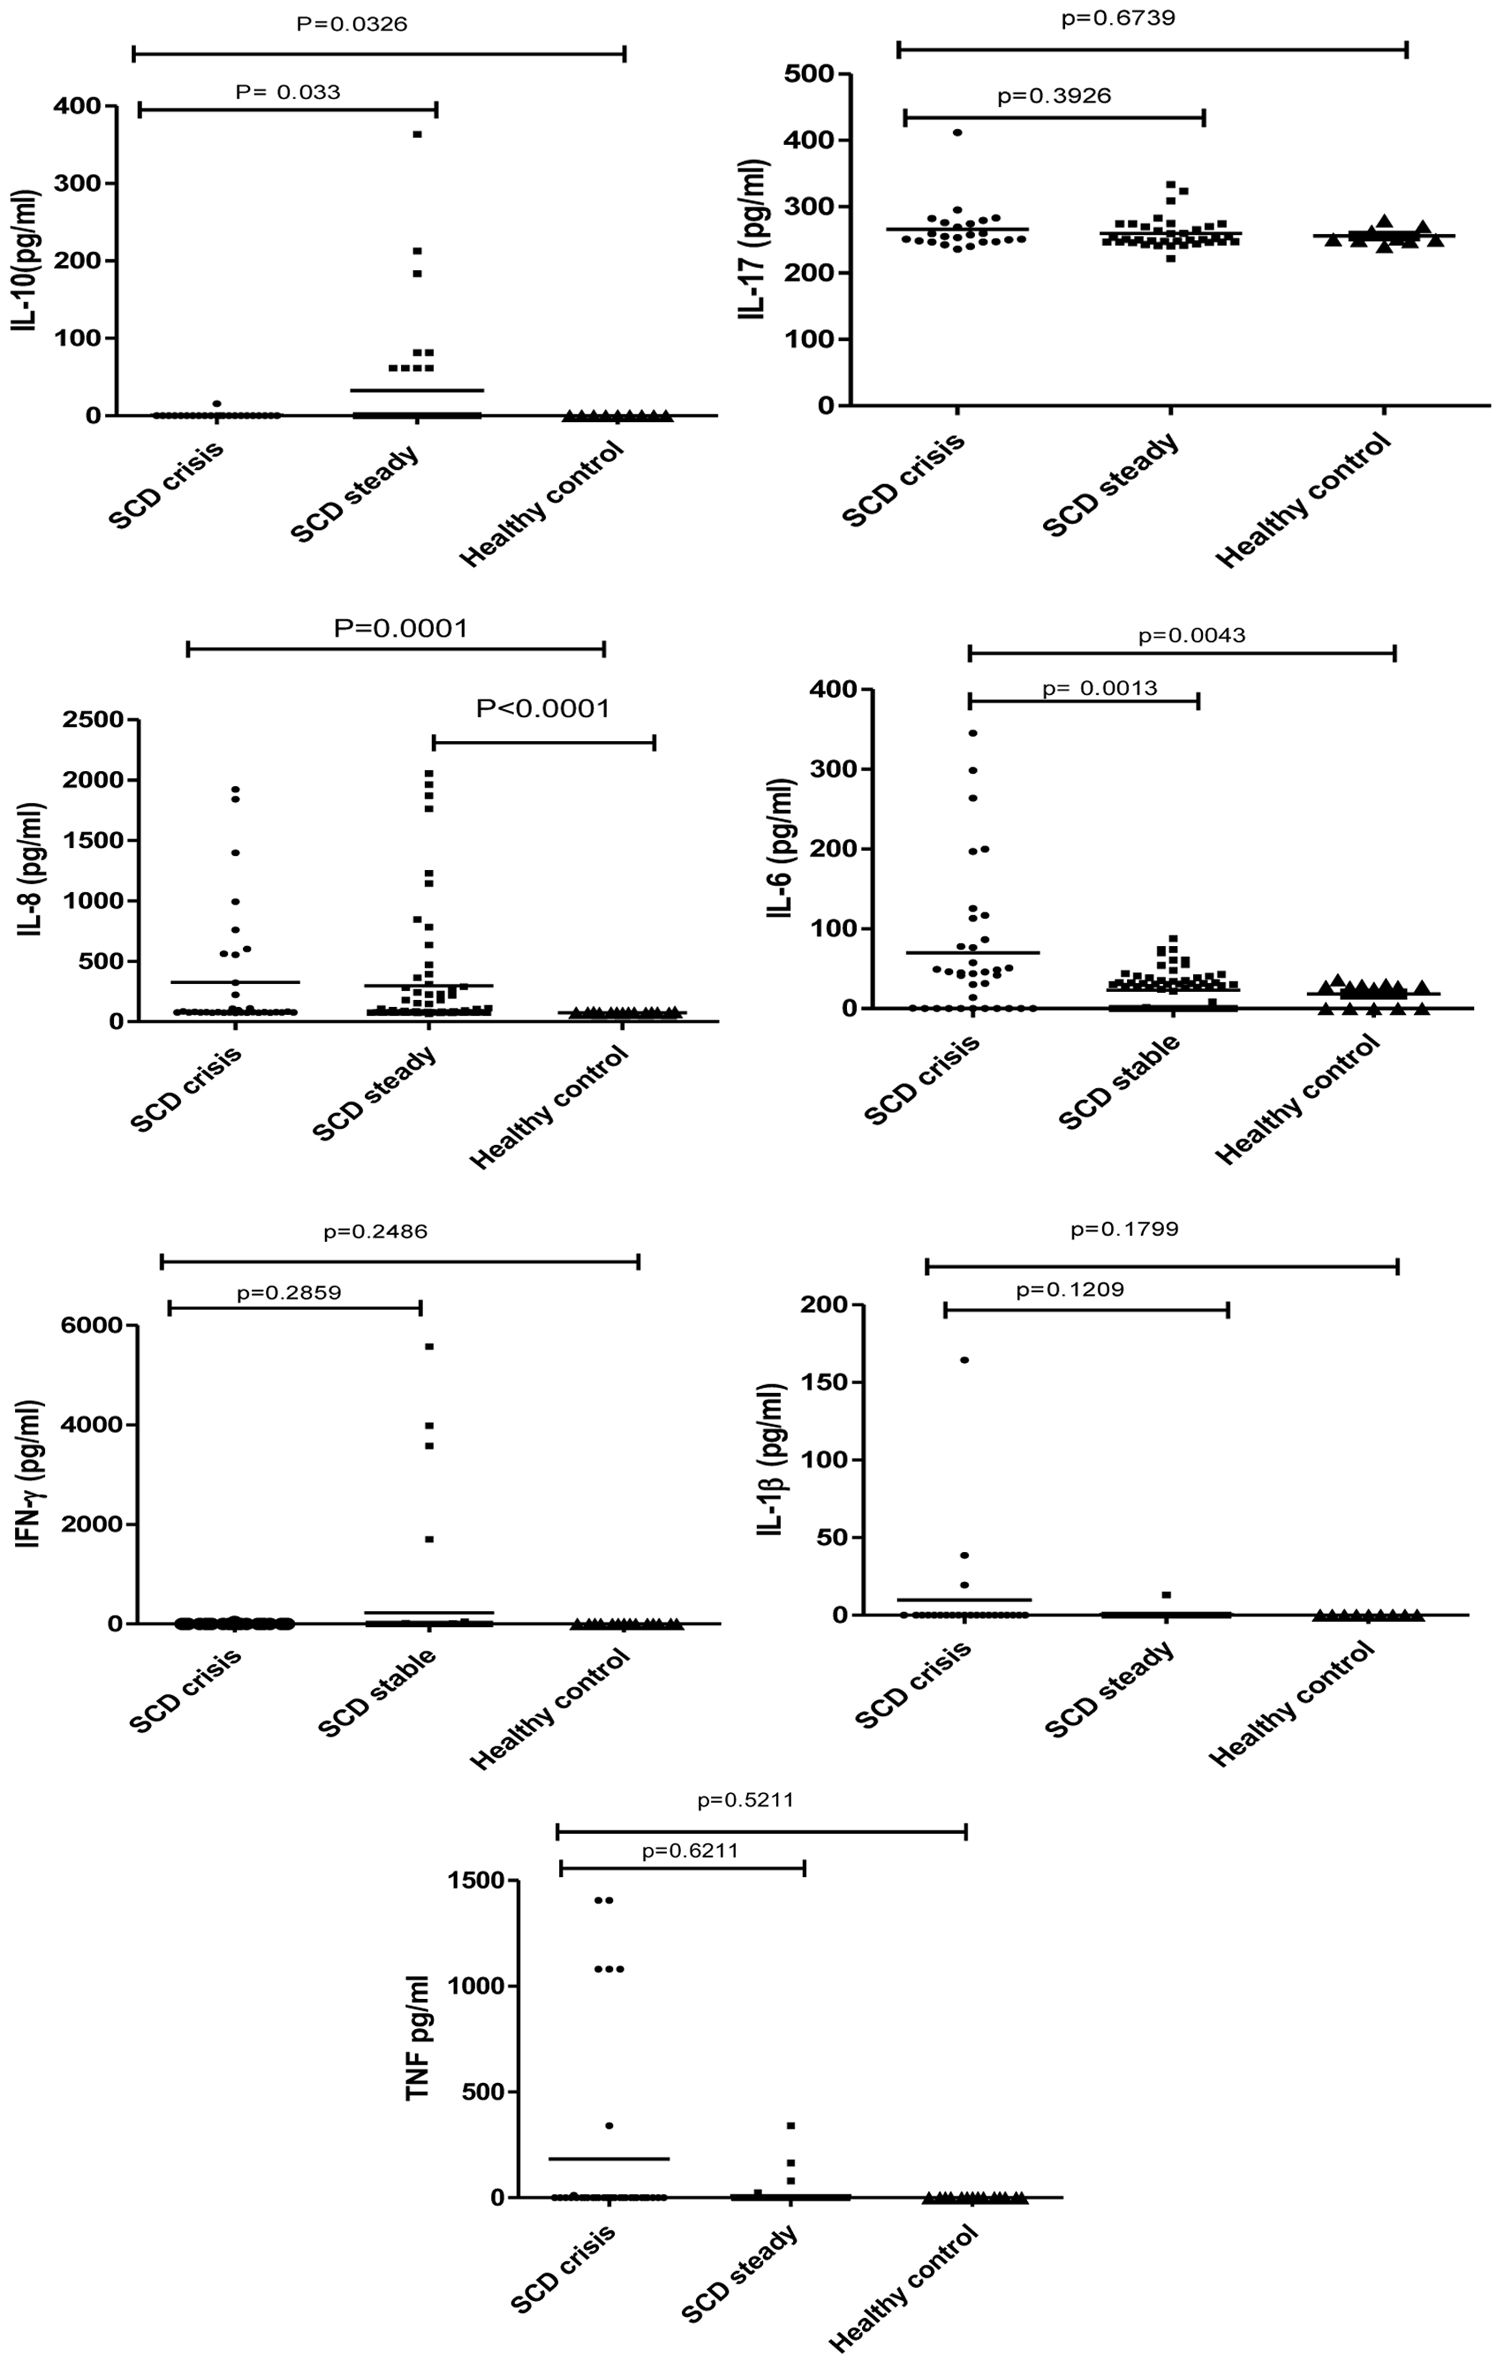
↓ Figure 1. Association between cytokines and
sickle cell disease patients in steady and crisis state, and healthy controls.
| Journal of Hematology, ISSN 1927-1212 print, 1927-1220 online, Open Access |
| Article copyright, the authors; Journal compilation copyright, J Hematol and Elmer Press Inc |
| Journal website https://jh.elmerpub.com |
Original Article
Volume 14, Number 3, June 2025, pages 124-132
Inflammatory Cytokines in Association With High Fetal Hemoglobin Level Reduce the Episodes of Vaso-Occlusive Crisis in Sickle Cell Patients
Figure
Tables
| Variable | Total (N = 521) |
|---|---|
| Age | |
| 6 - 16 years | 144 (27.63%) |
| 17 - 27 years | 153 (29.26%) |
| 28 - 38 years | 105 (20.15%) |
| 39 - 49 years | 68 (13.05%) |
| 49 - 59 years | 36 (6.90%) |
| 59 - 65 years | 15 (2.87%) |
| Mean age, years | 26.69 ± 17.00 |
| Male (N = 260) | 260 (49.90%) |
| Female (N = 261) | 261 (50.09%) |
| Hematological variables | Steady state (n = 180) | Crisis state (n = 96) | SCT (n = 117) | Healthy control (n = 128) | Crisis vs. steady state (Mann-Whitney z value) | Healthy control vs. crisis state (Mann-Whitney z value) | Healthy control vs. steady state (Mann-Whitney z value) | SCT vs. steady state (Mann-Whitney z value) | SCT vs. crisis state (Mann-Whitney z value) | Healthy control vs. SCT (Mann-Whitney z value) |
|---|---|---|---|---|---|---|---|---|---|---|
| *P < 0.05, **P < 0.001. Hb F: fetal hemoglobin; Hb S: sickle hemoglobin; HCT: hematocrit; MCH: mean corpuscular hemoglobin; MCHC: mean corpuscular hemoglobin concentration; MCV: mean corpuscular volume; RBC: red blood cell; RDW: red cell distribution width; SCT: sickle cell trait; SD: standard deviation; THR: platelet/thrombocytes; WBC: white blood cell. | ||||||||||
| Age (years) | 23.31 ± 14.83 | 25.16 ± 13.41 | 31.65 ± 17.65 | 27.08 ± 13.73 | ||||||
| Male/female | 96/84 | 49/47 | 54/63 | 61/67 | ||||||
| WBC count (× 109/L (mean ± SD) | 8.47 ± 3.57 | 11.74 ± 7.48 | 8.11 ± 3.37 | 7.37 ± 2.46 | -4.545** | -2.962* | -3.262* | -2.54* | -3.32* | -0.372 |
| RBC count (× 109/L) (mean ± SD) | 3.51 ± 1.01 | 3.32 ± 1.12 | 4.59 ± 0.87 | 4.61 ± 1.03 | -1.593 | -7.495** | -9.024** | -10.07** | -8.36488** | -2.261* |
| MCV (fL) (mean ± SD) | 88.73 ± 10.32 | 85.83 ± 12.98 | 81.46 ± 9.21 | 84.20 ± 9.34 | -2.058* | -0.455 | -3.636** | -4.705** | -1.662 | -1.466 |
| HCT (L/L) (mean ± SD) | 30.60 ± 9.40 | 27.57 ± 8.96 | 34. ± 4.09 | 38.63 ± 9.29 | -2.143* | -7.334** | -7.189** | -7.549** | -7.80** | -0.755 |
| MCH (pg) (mean ± SD) | 27.56 ± 5.03 | 29.05 ± 8.78 | 25.70 ± 5.14 | 26.90 ± 5.13 | -0.400 | -1.500 | -1.427 | -2.950* | -2.815* | -1.677 |
| MCHC (g/dL) (mean ± SD) | 30.85 ± 3.58 | 32.95 ± 4.47 | 31.00 ± 5.82 | 31.90 ± 4.19 | -3.299* | -1.564 | -1.679 | -.0.312 | -2.047* | -0.911 |
| RDW (%) (mean ± SD) | 16.00 ± 3.58 | 15.52 ± 5.74 | 15.30 ± 10.59 | 12.25 ± 2.22 | -2.456* | -6.497** | -9.803** | -.0.8447** | -5.509** | -1.065 |
| Hb (g/dL) (mean ± SD) | 9.34 ± 1.87 | 8.85 ± 2.32 | 11.83 ± 1.87 | 12.36 ± 3.47 | -1.159 | -7.591** | -9.029** | -9.431** | -7.92** | -1.096 |
| THR (mean ± SD) | 236.92 ± 171.46 | 305.30 ± 192.21 | 211.15 ± 122.63 | 209.40 ± 107.60 | -1.815 | -1.166 | -480 | -0.430 | -1.163 | -0.164 |
| Hb F (%) (mean ± SD) | 20.02 ± 5.04 | 18.84 ± 6.31 | 1.28 ± 1.12 | 0.66 ± 0.45 | -1.179* | -12.60** | -14.89** | -17.071** | -13.004** | -7.264** |
| Hb S (%) (mean ± SD) | 71.91 ± 6.60 | 71.21 ± 8.09 | 31.54 ± 5.90 | NA | -0.628 | NA | NA | -16.64** | -13.004** | NA |
| Cytokine | Coefficient | Standard error | Lower 95% confidence interval | Upper 95% confidence interval | Odds ratio | P value |
|---|---|---|---|---|---|---|
| Significant association *P < 0.05. Hb F: fetal hemoglobin; IL: interleukin; SCD: sickle cell disease. | ||||||
| Hb F | -0.050193 | 0.032364 | -0.113625 | 0.0132385 | 0.951046 | 0.121 |
| Model 1 | ||||||
| Hb F | -0.130237 | 0.051297 | -0.2307774 | -0.0296959 | 0.877888 | 0.011* |
| IL-17 | 0.0060895 | 0.00994 | -0.013393 | 0.025572 | 1.006108 | 0.54 |
| Model 2 | ||||||
| Hb F | -0.132508 | 0.052174 | -0.2347672 | -0.0302486 | 0.875896 | 0.011* |
| IL-10 | 0.0003799 | 0.007235 | -0.0138011 | 0.014561 | 1.00038 | 0.958 |
| Model 3 | ||||||
| Hb F | -0.130346 | 0.053042 | -0.234307 | -0.0263852 | 0.877792 | 0.014* |
| IL-β | 0.0491697 | 0.063141 | -0.0745843 | 0.1729238 | 1.050399 | 0.436 |
| Cytokine | Coefficient | Standard error | Lower 95% confidence interval | Upper 95% confidence interval | Odds ratio | P value |
|---|---|---|---|---|---|---|
| Hb F: fetal hemoglobin; IFN: interferon; IL: interleukin; SCD: sickle cell disease; TNF: tumor necrosis factor. | ||||||
| IL-6 | 0.0065854 | 0.003496 | -0.0002658 | 0.0134366 | 1.006607 | 0.06 |
| IL-17 | 0.0076512 | 0.009619 | -0.011201 | 0.0265035 | 1.007681 | 0.426 |
| IL-8 | 0.0001269 | 0.00043 | -0.0007164 | 0.0009702 | 1.000127 | 0.768 |
| TNF-α | 0.002244 | 0.001758 | -0.0012016 | 0.0056897 | 1.002247 | 0.202 |
| IFN-γ | -0.002933 | 0.009023 | -0.026165 | 0.0147509 | 0.997072 | 0.745 |
| IL-10 | -0.00375 | 0.006572 | -0.0166307 | 0.0091312 | 0.996273 | 0.568 |
| IL-1β | 0.0806308 | 0.068892 | -0.0543955 | 0.2156572 | 1.083971 | 0.242 |
| Hb F | -0.050193 | 0.032364 | -0.113625 | 0.0132385 | 0.951046 | 0.121 |