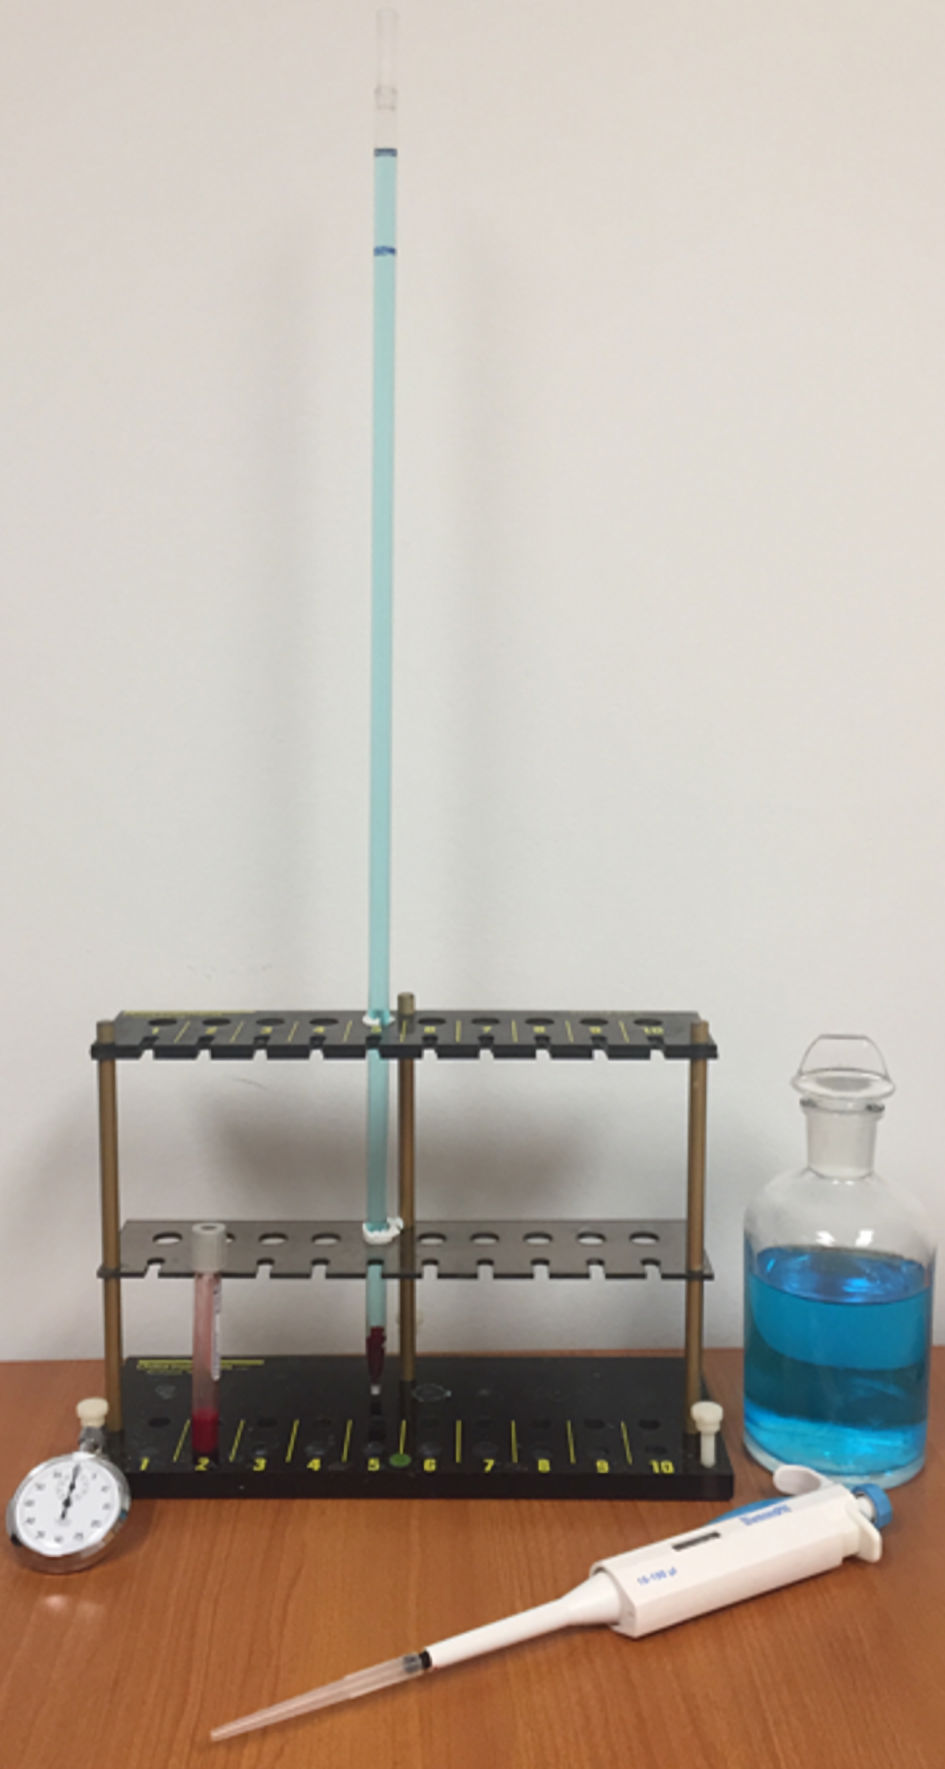
↓ Figure 1. Components of the falling drop
hemoglobin method, showing only one glass column.
| Journal of Hematology, ISSN 1927-1212 print, 1927-1220 online, Open Access |
| Article copyright, the authors; Journal compilation copyright, J Hematol and Elmer Press Inc |
| Journal website https://jh.elmerpub.com |
Original Article
Volume 13, Number 6, December 2024, pages 261-267
Optimizing Falling Drop Hemoglobin Method by Comparing Capillary Versus Venous Blood and Determining the Stability of the Copper Sulfate Solution
Figures
Tables
| Collection method | Number of trials (n) | Average Hct (%) | Average time (s) | Intra-run SD (s) | Inter-run SD (s) |
|---|---|---|---|---|---|
| SD: standard deviation; Hct: hematocrit. | |||||
| Capillary | 4 | 19.75 | 42.50 | 4.09 | 3.03 |
| Venous | 4 | 25.50 | 38.20 | 3.32 | 2.46 |
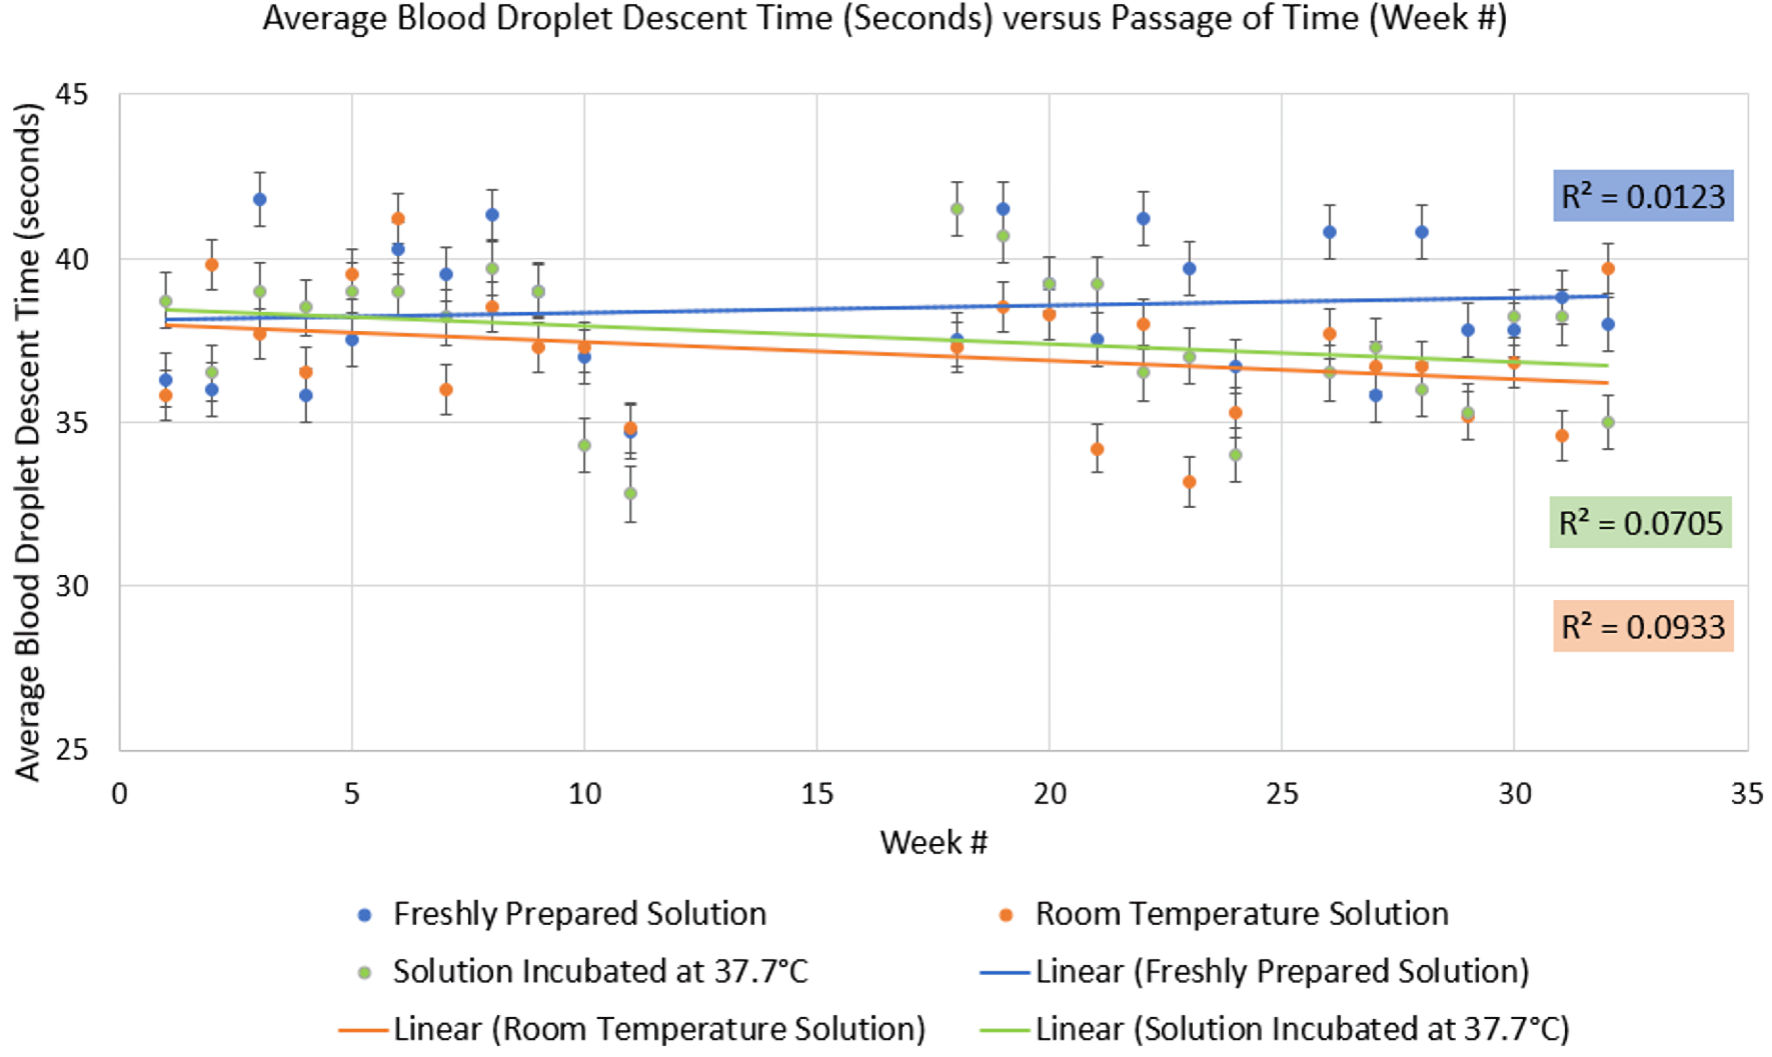
| Freshly prepared solution | Room temperature solution | Solution incubated at 37.7 °C | |
|---|---|---|---|
| Average descent time (s) | 38.5 | 37.0 | 37.6 |
| Average standard deviation of descent time (s) | 3.840094 | 3.064603 | 4.197985 |
| Range of descent time (s) | 7.1 | 8.0 | 8.7 |